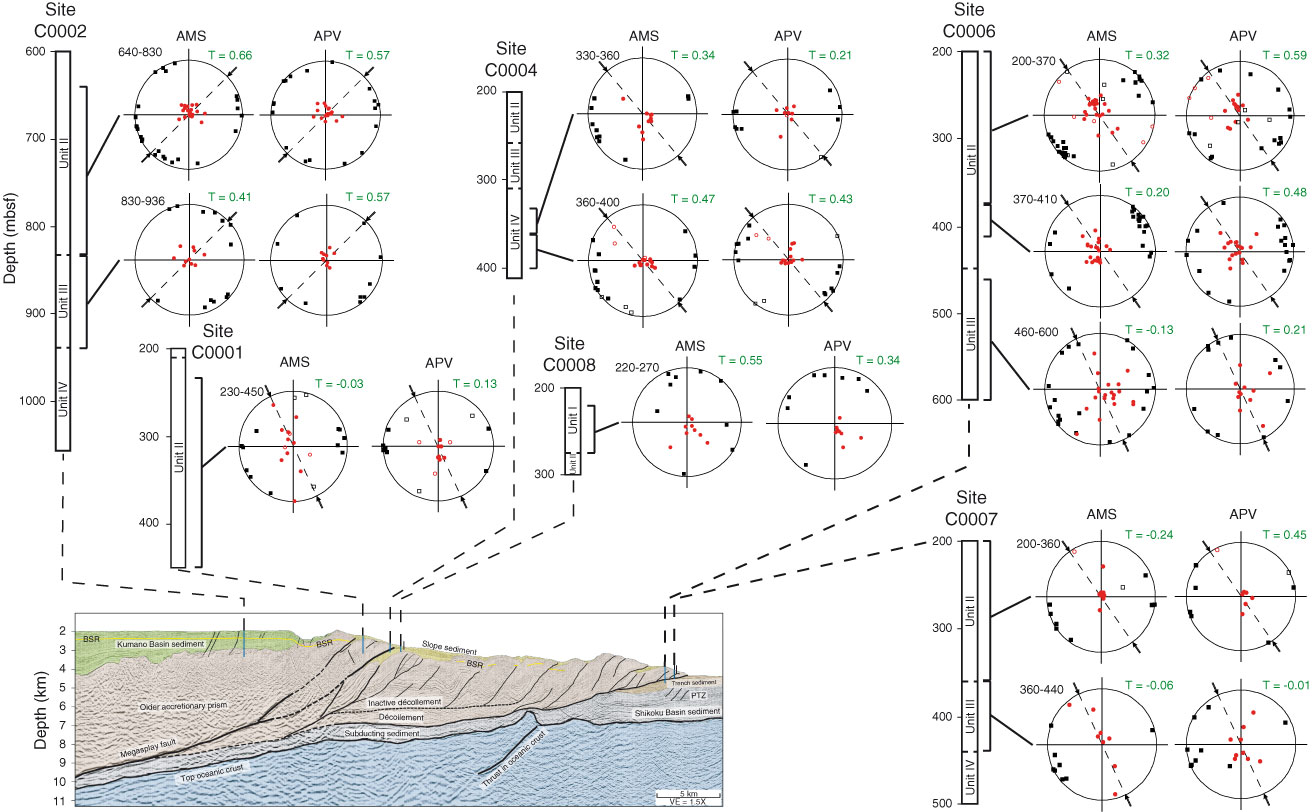
Figure F5. Lower hemisphere stereoplots for anisotropy of magnetic susceptibility (AMS) and anisotropy of P-wave velocity (APV) eigenvectors distributed by site and (sub)unit. The depth range in meters below seafloor (mbsf) for each pair of plots is provided at the top left corner of the AMS plots, and the average Tj value for each interval is provided at the top right corner of every plot. Arrows indicate maximum horizontal stress derived from borehole breakouts by Chang et al. (2010), when available. Solid black squares = direction of maximum value, solid red circles = direction of minimum value. Open symbols correspond to very low anisotropies or specimens with evident misorientations. BSR = bottom-simulating reflector. PTZ = protothrust zone. VE = vertical exaggeration.
Previous | Close | Next | Top of page