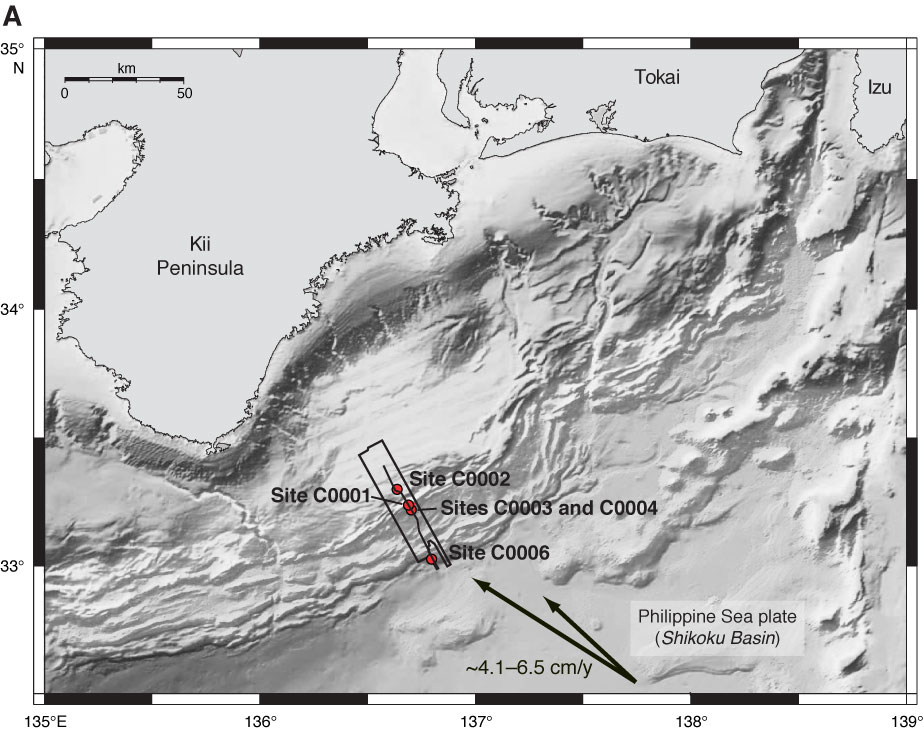
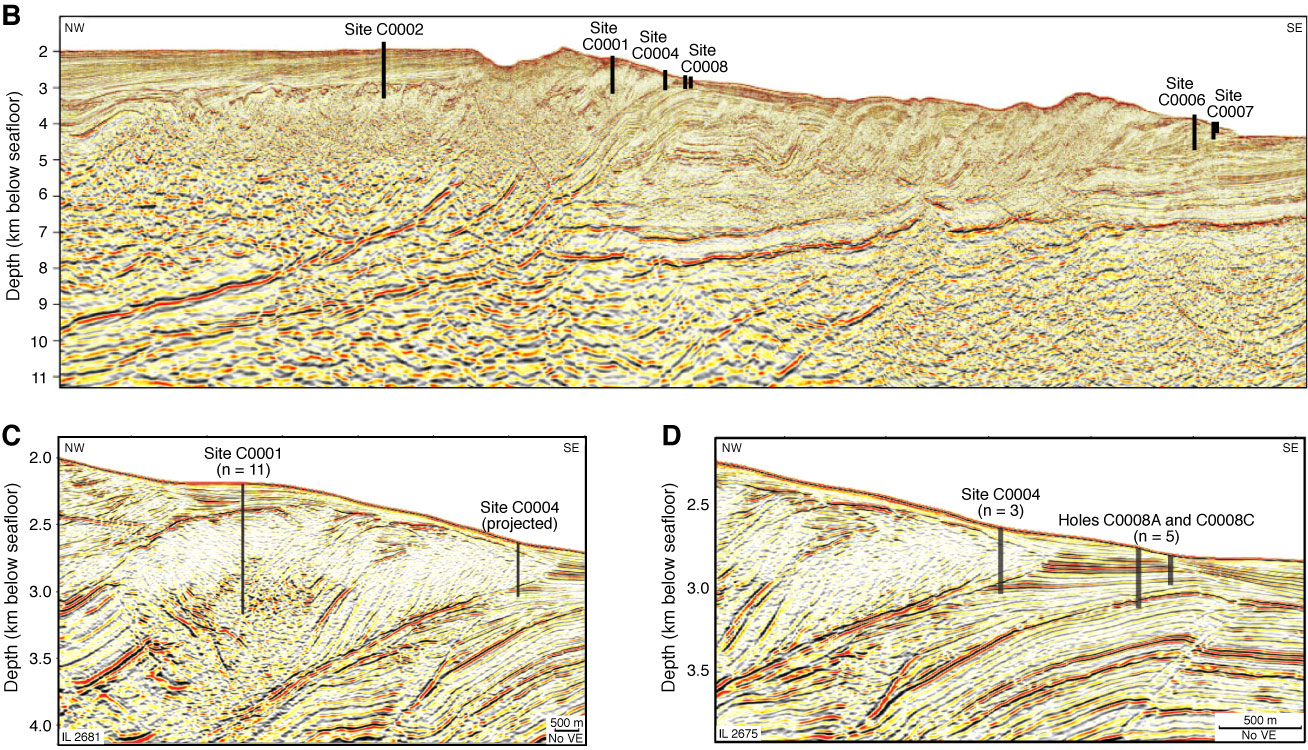
Figure F1. A. Map showing location of study area and boreholes (after Kinoshita et al., 2008, and Moore et al., 2009). B. Regional composite seismic line that crosses boreholes (location shown in A). C, D. Detailed seismic sections showing Sites C0001, C0004, and C0008. VE = vertical exaggeration. n = number of specimens from each drill site used in this study. (All parts after Moore et al., 2009.)
Close | Next | Top of page