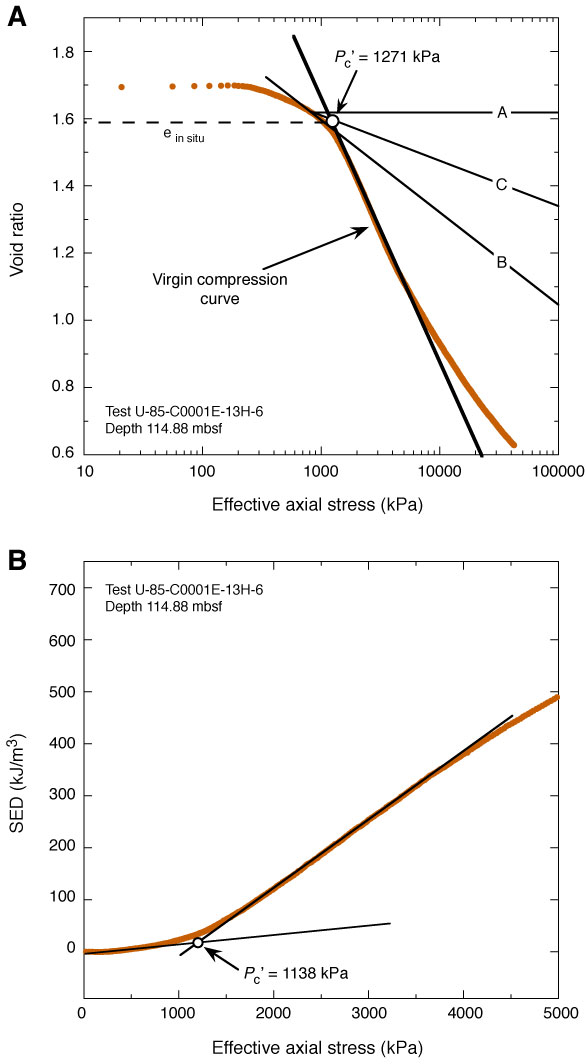
Figure F4. A. Example of void ratio–effective axial stress curve showing determination of Pc′ following the Casagrande approach (Casagrande, 1936). Using this method, a line (segment B) is drawn tangent to the data at the point of maximum curvature. A line of constant void ratio is drawn from the same point (segment A), and the most likely preconsolidation stress (Pc′) is given by the intersection of a line that bisects the angle between the two (segment C) and the virgin compression curve. We estimate the in situ void ratio as the void ratio at Pc′ (Table T3). The slope of the virgin compression curve defines the compression index (Cc) (see Equation 8 in text). B. Example of strain energy density–effective axial stress plot, showing the work-stress method for estimating Pc′ (Becker et al., 1987). In this method, line segments are fit to the early part of the data and to the data during virgin compression, and Pc′ is defined by their intersection. SED = strain energy density.
Previous | Close | Next | Top of page