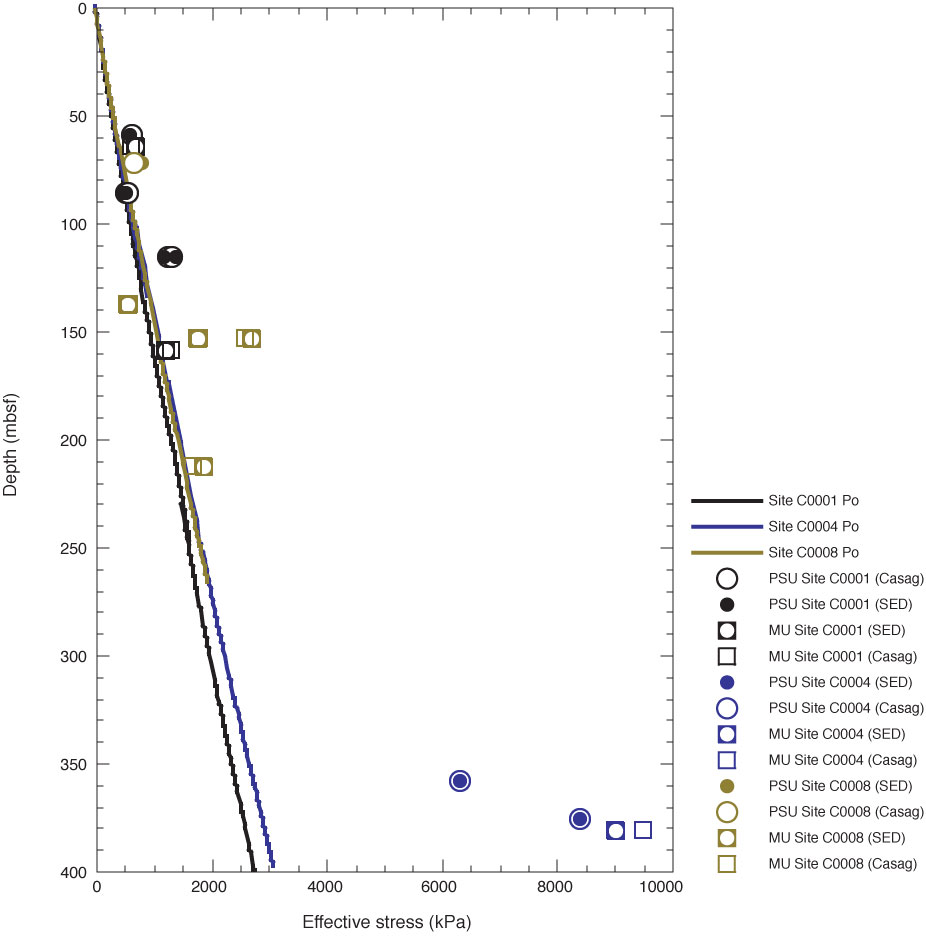
Figure F45. Values of Pc′ for each experiment plotted as a function of depth. Curves showing the expected hydrostatic effective stress (Po) for each drill site are shown for comparison. Casag = Casagrande method, SED = strain energy density (work-stress) method.
Previous | Close | Next | Top of page