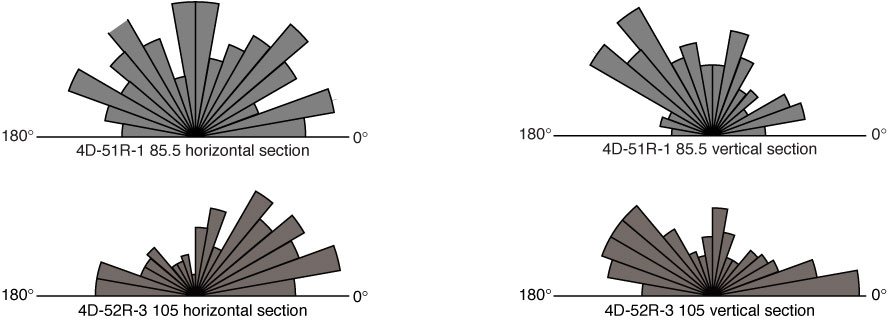
Figure F47. Rose diagrams of ESEM fabric results for samples from Site C0004 (excluding Sample C0004D-47R-2, for which a sample for ESEM analysis was not obtained), showing particle orientations (apparent long axis) binned in 10° increments.
Previous | Close | Next | Top of page