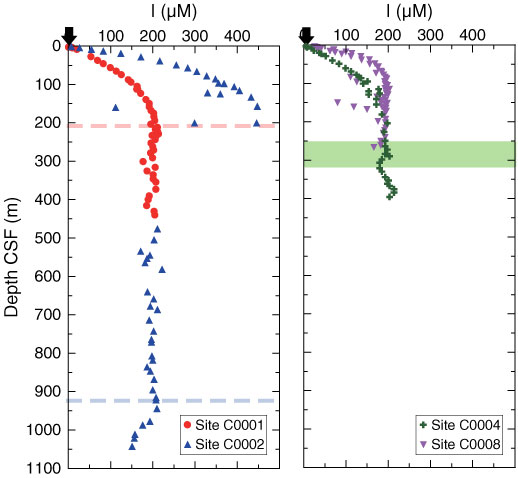
Figure F1. Depth profiles of iodine concentrations. No samples were recovered at Site C0002 between 201 and 477 m CSF. Red and blue dashed lines = lithologic boundary between overlying Kumano forearc basin sediment and underlying accreted sediments at Sites C0001 and C0002, respectively (Ashi et al., 2008), green band = brecciated/fractured zone of megasplay fault (Kimura et al., 2008), arrows = iodine seawater value of 0.4 µM (Broecker and Peng, 1982; Burton, 1996).
Close | Next | Top of page