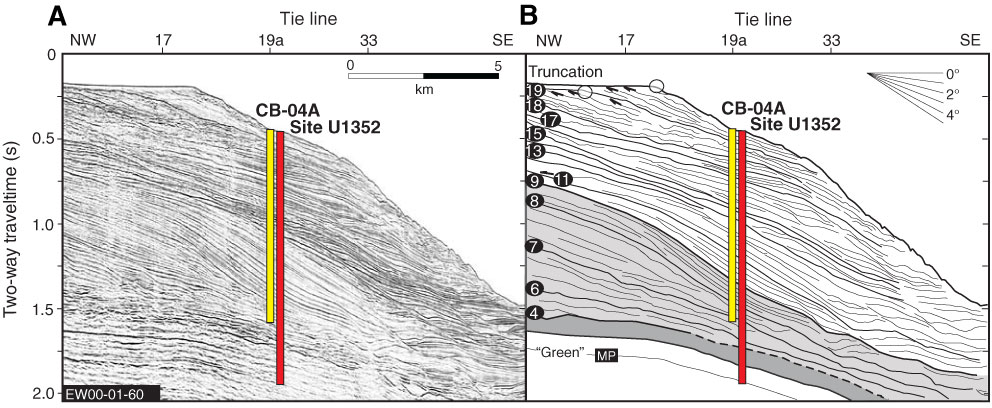
Figure F9. A. Uninterpreted dip Profile EW00-01-60 across the slope (southern part of survey grid; see Fig. F3 for location). B. Interpretation showing seismic sequence boundaries and selected locations of reflection truncation (arrows). Site U1352 sampled slope facies of sequences (particularly important for age control) and the underlying Marshall Paraconformity (MP). Alternate Site CB-04A is also shown. Red = actual penetration, yellow = proposed penetration.
Previous | Close | Next | Top of page