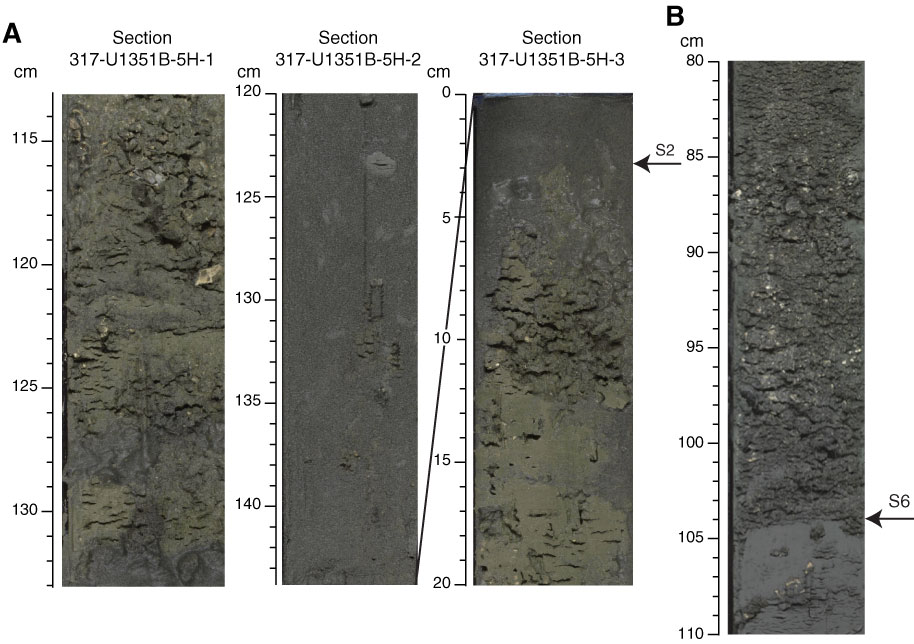
Figure F12. Core photographs of lithologies associated with lithologic surfaces in Unit I. A. Intervals 317-U1351B-5H-1, 113–135 cm; 5H-2, 120–145 cm; and 5H-3, 0–20 cm. The depth of the sand bed base (surface U1351B-S2) correlates with the predicted depth of seismic sequence boundary U18. B. Interval 317-U1351B-19X-2, 80–110 cm. A sharp, heavily bioturbated contact separates the shell bed above from the clayey mud beneath. This surface (U1351B-S6) is near the predicted depth of U13.
Previous | Close | Next | Top of page