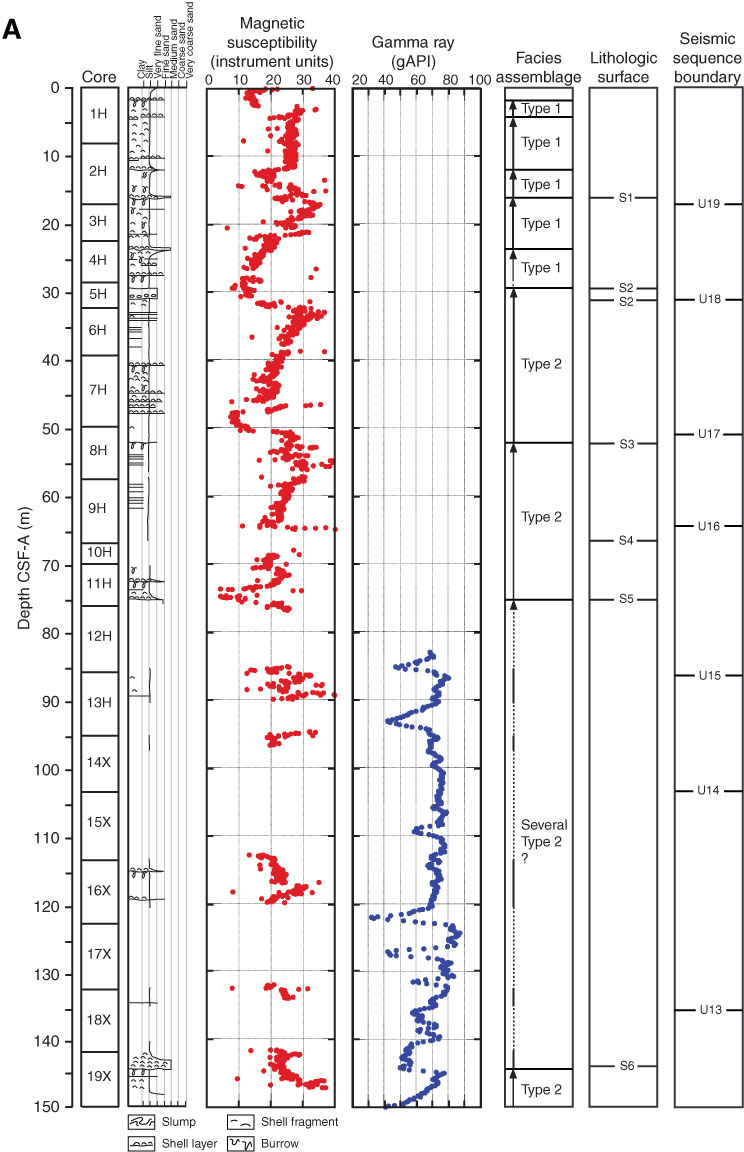
Figure F16. Summary of some shipboard analyses for Hole U1351B showing a graphical depiction of recovered core, magnetic susceptibility, gamma ray logging data, the distribution of facies assemblages, lithologic surfaces identified in the cores, and seismic sequence boundaries (the latter after Lu and Fulthorpe, 2004). Downhole logging data are plotted on the WMSF depth scale. A. 0–150 m CSF-A. (Continued on next page.)
Previous | Close | Next | Top of page