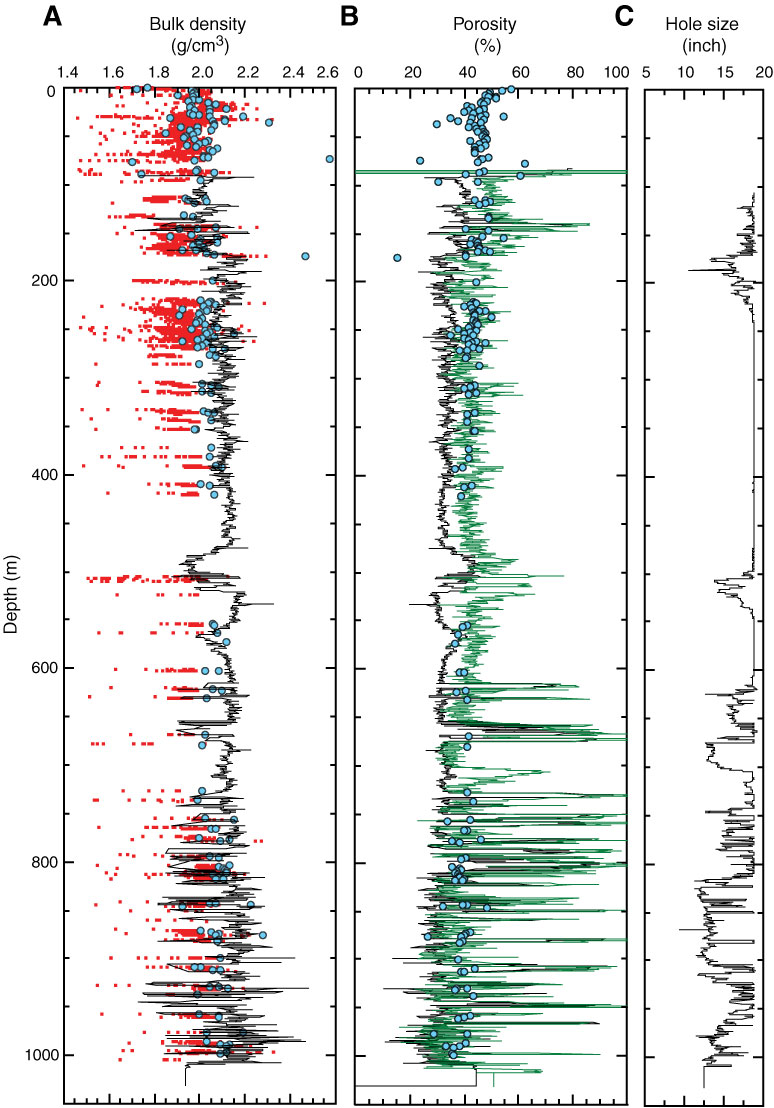
Figure F35. A. Comparison of GRA bulk density (red), density from downhole logs (black), and MAD bulk density (blue), Hole U1351B. Data points affected at the ends of core sections are removed from GRA bulk density data. B. Comparison of MAD porosity (blue), neutron porosity from downhole logs (green), and porosity from downhole density logs (black), Hole U1351B. C. Hole size, based on caliper measurements during downhole logging, plotted to aid interpretation of downhole logging results. Depth (m) refers to CSF-A for MAD and GRA core data and to WMSF for downhole logging data.
Previous | Close | Next | Top of page