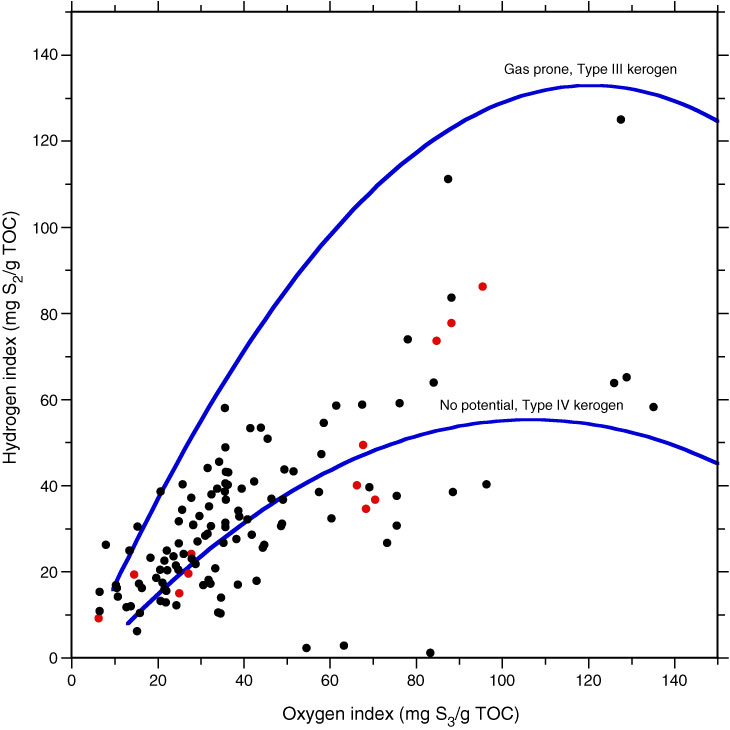
Figure F52. Modified and enlarged van Krevelen diagram based on a cross-plot of hydrogen index vs. oxygen index, showing trend lines for kerogen Types III and IV, Holes U1351A (red) and U1351B (black). Trend lines are not shown for kerogen Types I and II. TOC = total organic carbon from SRA.
Previous | Close | Next | Top of page