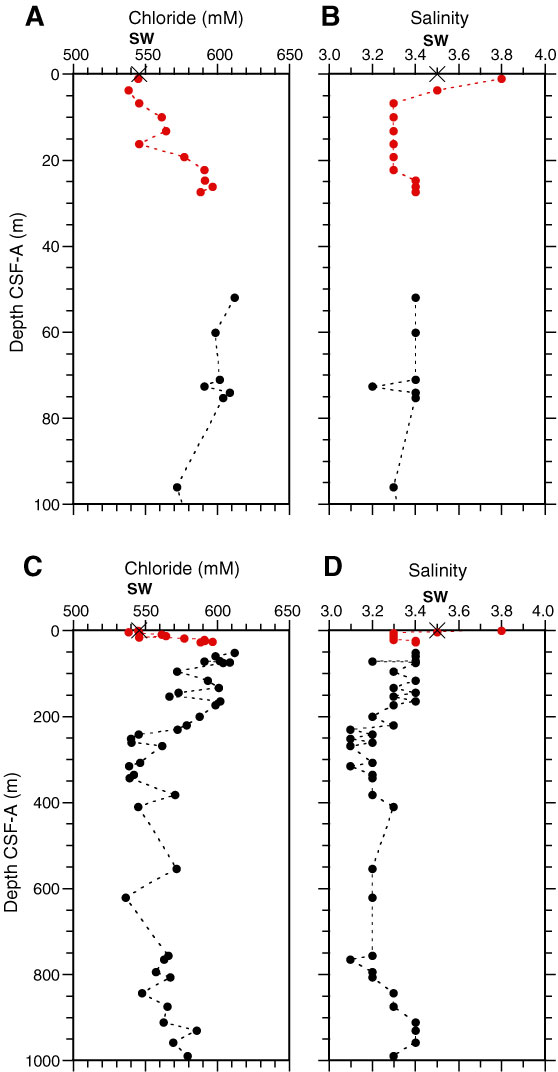
Figure F55. Plots of ionic constituents of interstitial water vs. depth, Holes U1351A (red) and U1351B (black). A, C. Chloride. B, D. Salinity. Bottom panels show total depth; top panels show uppermost 100 m. SW = IAPSO seawater values.
Previous | Close | Next | Top of page