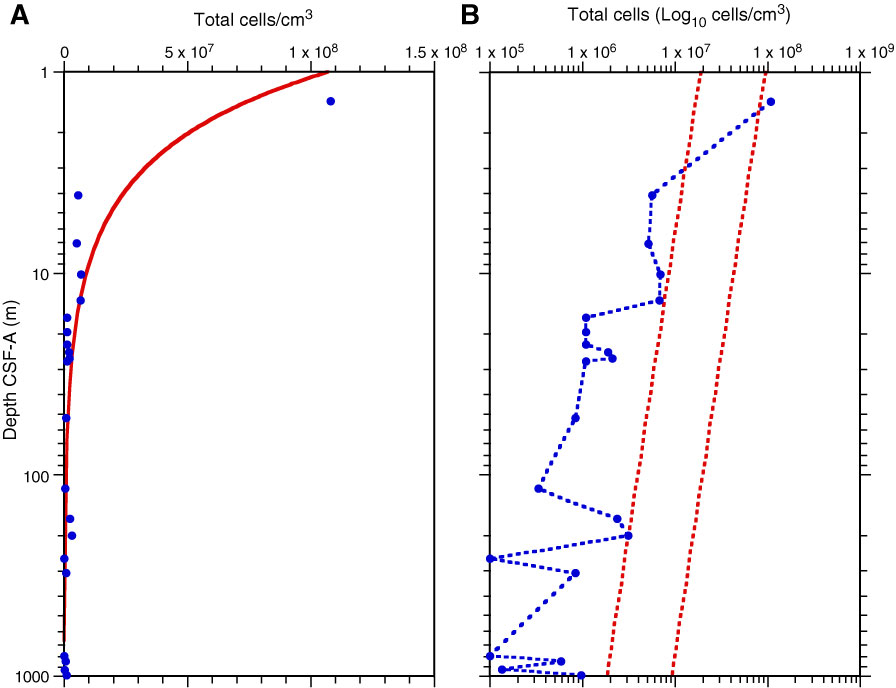
Figure F62. Plots of variation in total prokaryotic cells counted by SYBR Green staining vs. depth, Site U1351. A. Total cells/cm3 on a linear scale. B. Total cells/cm3 on a logarithmic scale (blue circles and line) and total prokaryotic cell range distribution for previously examined sites (red dashed lines; from Parkes et al., 2000).
Previous | Close | Next | Top of page