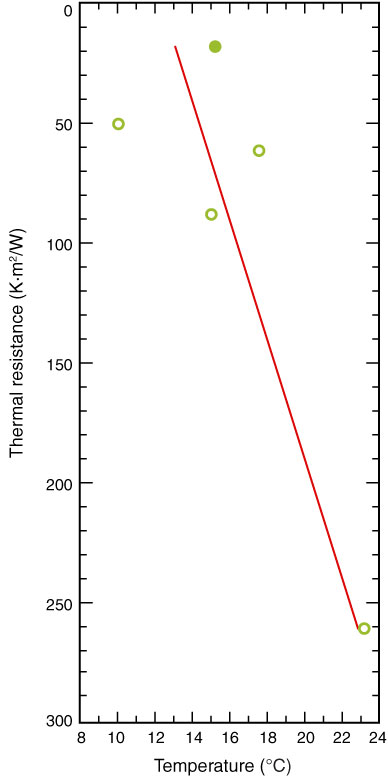
Figure F65. Bullard plot for Site U1351. Thermal resistance is derived from the linearly increasing trend of thermal conductivity with depth. Estimated heat flow is 20.1 mW/m2. Solid circle = only reliable data point.
Previous | Close | Next | Top of page