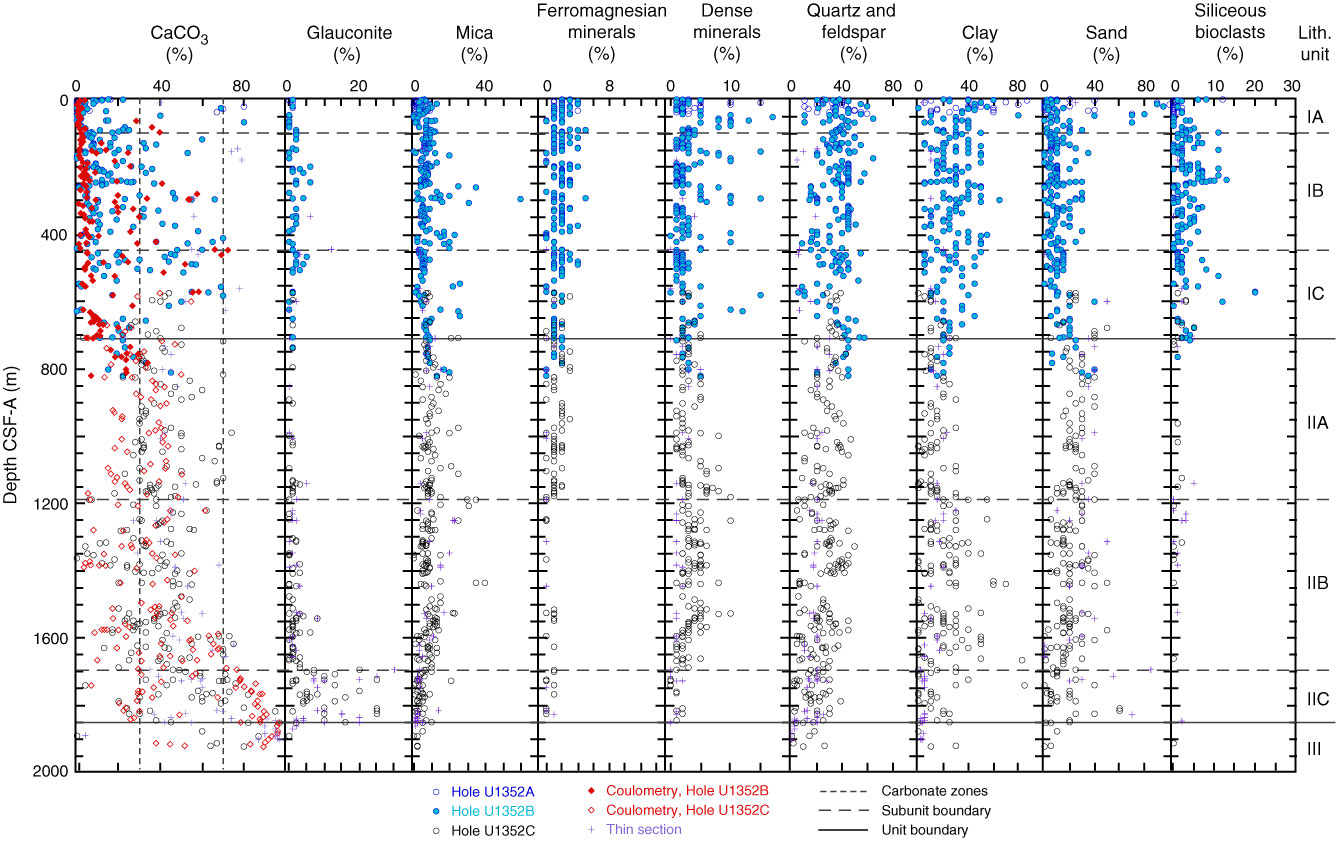
Figure F10. Mineral and textural percentage estimates based on smear slide observations, Site U1352. CaCO3 estimates are plotted against data from coulometry analyses for comparison (see "Geochemistry and microbiology"). Clay and sand fractions tend to vary opposite each other, siliceous bioclasts and ferromagnesian minerals both diminish in Unit II, and glauconite increases abruptly in Subunit IIC. Mica refers to undifferentiated micas, biotite, muscovite, and chlorite.
Previous | Close | Next | Top of page