Previous | Close | Next
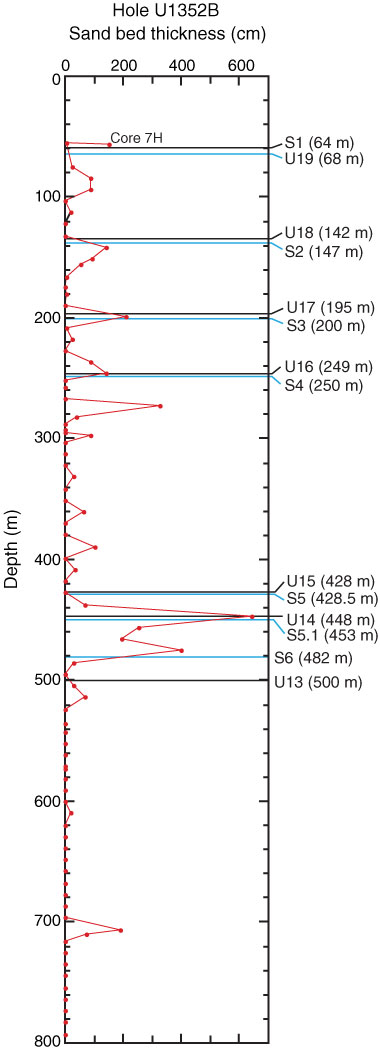
Figure F23. Hole U1352B interpretation of correlation between sand bed thickness, surfaces U1352B-S1 to U1352B-S6, and seismic sequence boundaries U19–U13.
Previous | Close | Next | Top of page