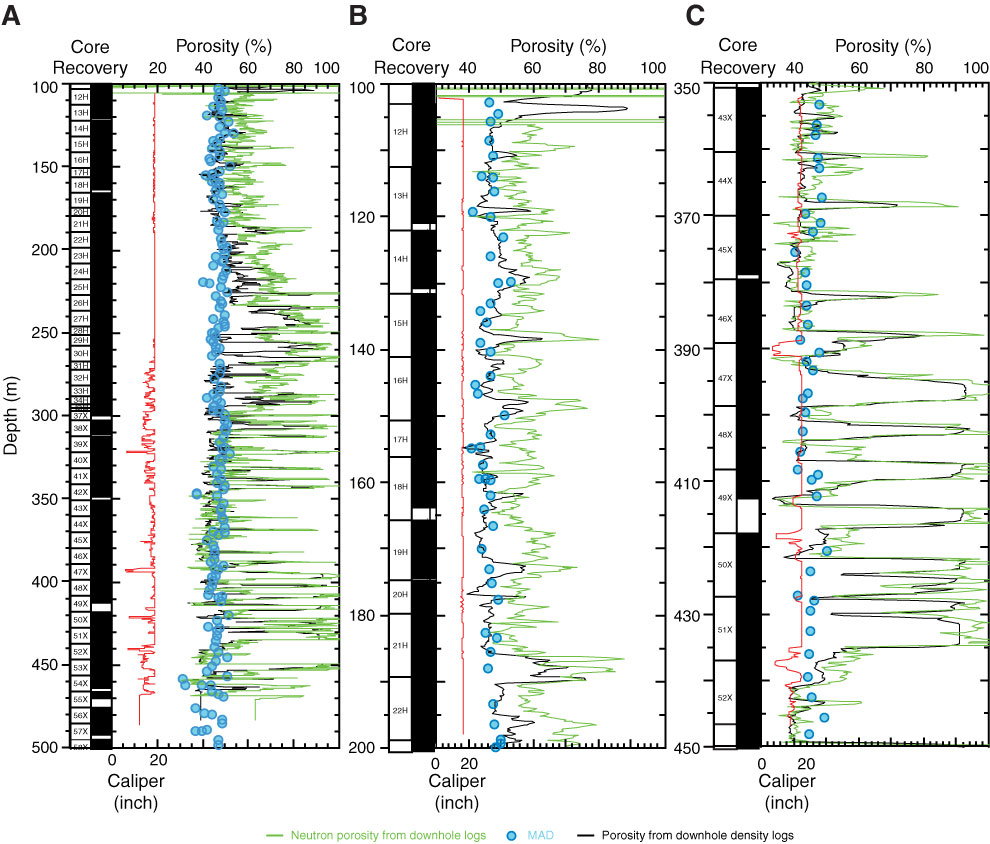
Figure F43. Comparison of moisture and density (MAD) porosity (blue circles), neutron porosity from downhole logs (green curves), and porosity derived from downhole density logs (black curves), Hole U1352B. Hole size, based on caliper measurements during downhole logging, is shown by the red curve. A. The entire cored interval for which downhole logging results are available, 100–500 m. B. Detail of the top portion of the logged interval, 100–200 m. C. Detail of the lower portion of the logged interval, 350–450 m. Core recovery data (black = recovered intervals) are shown to the left. Note that depth (m) refers to CSF-A for core data and to WMSF for logging data.
Previous | Close | Next | Top of page