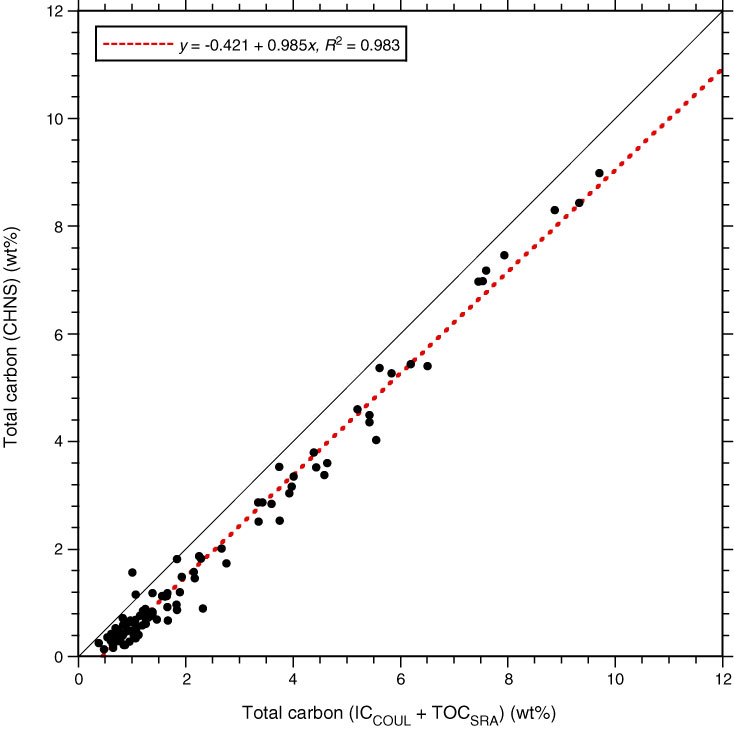
Figure F49. Cross-plot of total carbon measured using two approaches: (1) direct measurement with the CHNS elemental analyzer and (2) the sum of inorganic carbon measured by the coulometer (ICCOUL) and total organic carbon measured by the source rock analyzer (TOCSRA). Black line = 1:1 line, dashed red line = correlation line for all data.
Previous | Close | Next | Top of page