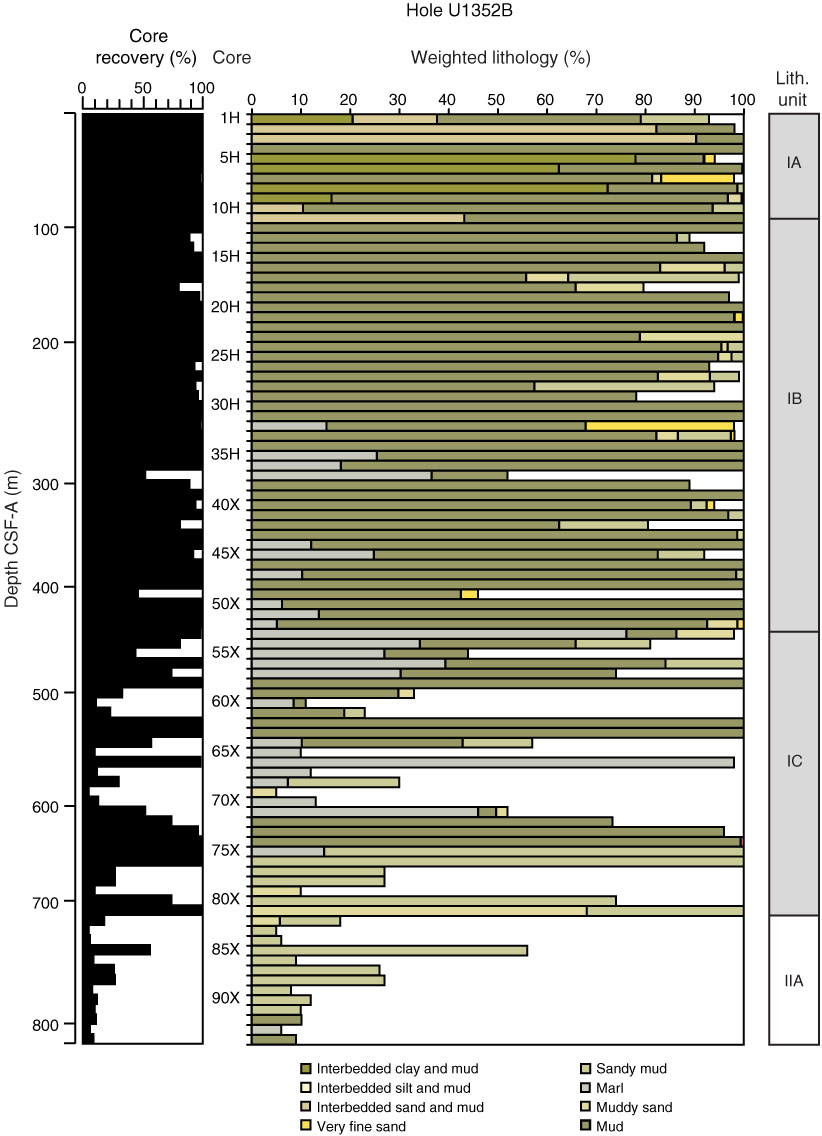
Figure F5. Core recovery and lithology shown as a proportion of the recovered interval (lithology [%] × recovery [%]/100) in Hole U1352B. Depth scale in CSF-A (m) is variable, but for graphical purposes each core is depicted by an equally thick horizontal bar.
Previous | Close | Next | Top of page