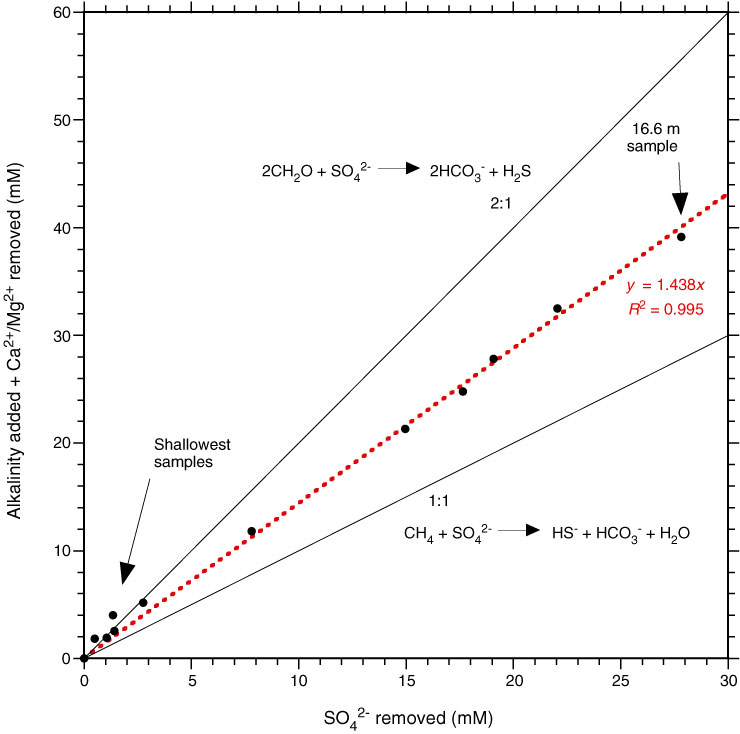
Figure F62. Plot showing stoichiometry of the sulfate-reduction zone for the 12 samples shallower than 17 m in Hole U1352A. Equations for methane oxidation (bottom) and organic matter oxidation (top) are shown. Data from Hole U1352A plot close to the 1.5:1 line (correlation line and equation shown in red).
Previous | Close | Next | Top of page