Previous | Close | Next
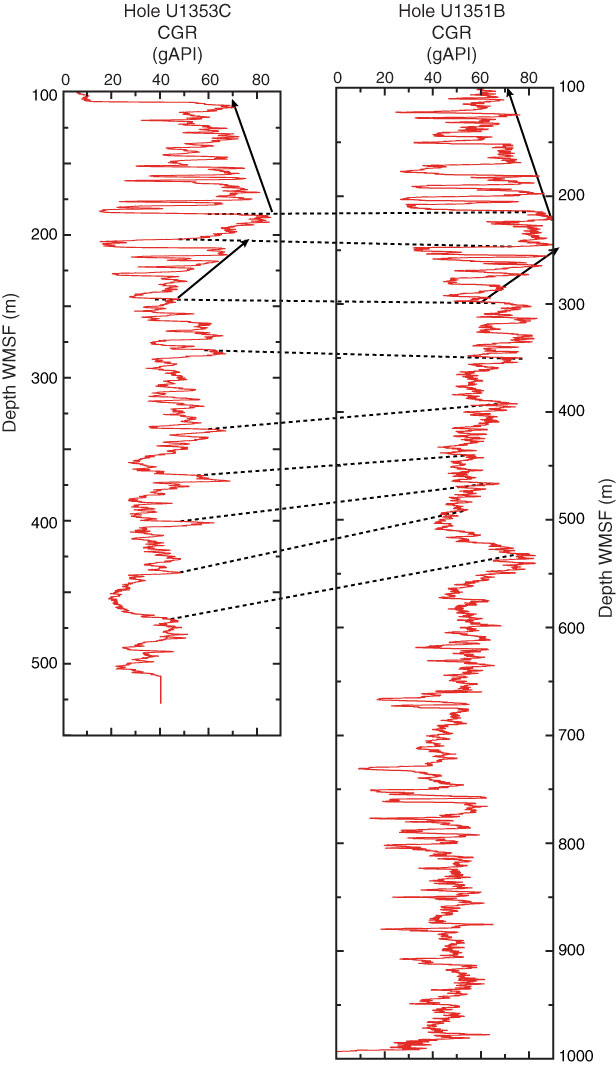
Figure F13. Correlation of computed gamma ray (CGR) logging data from Holes U1353C and U1351B. Dashed lines = tie points between similar features, arrows = potential coarsening- and fining-upward trends.
Previous | Close | Next | Top of page