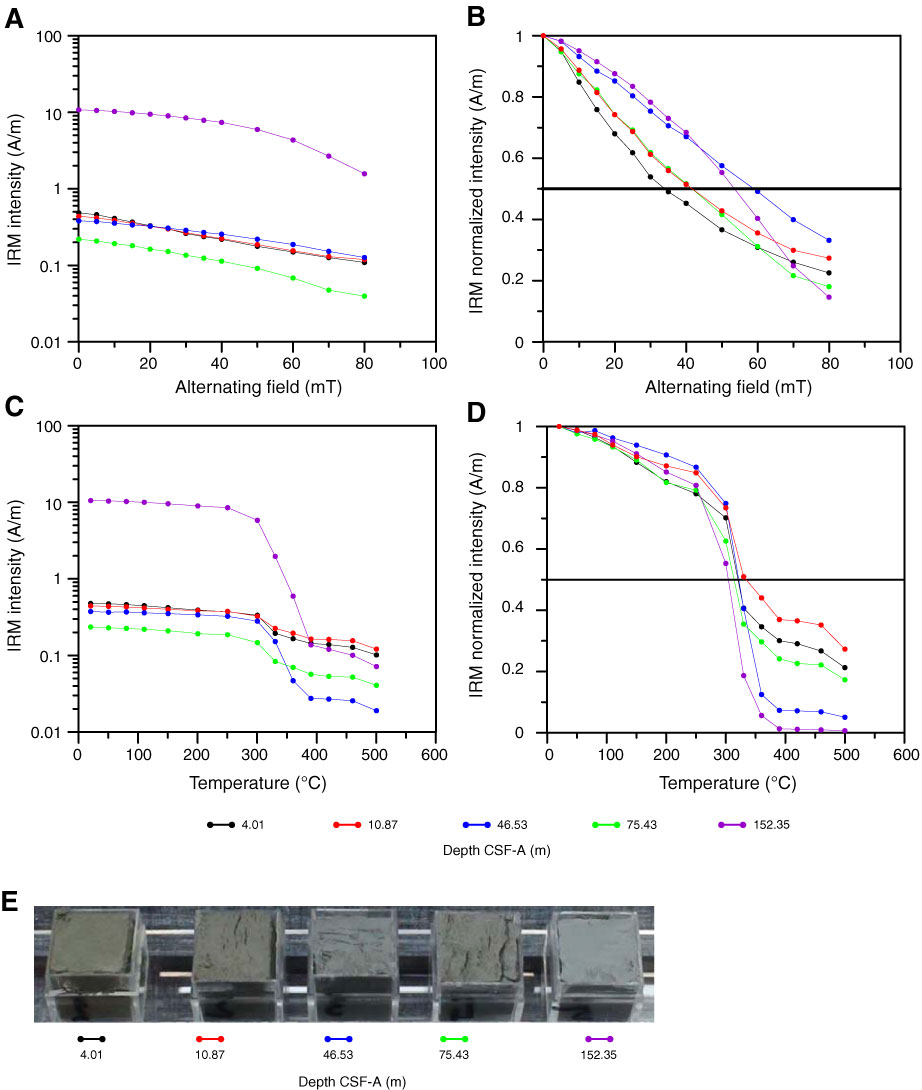
Figure F22. A. AF demagnetization of isothermal remanent magnetization (IRM) at 1 T for samples from Hole U1353B. B. Same as A but with intensities normalized to IRM at 1 T. C. Thermal demagnetization of IRM at 1 T for samples from Hole U1353B. D. Same as C but with intensities normalized to IRM at 1 T. E. Photograph of the measured cubes showing color differences related to lithology.
Previous | Close | Next | Top of page