Previous | Close | Next
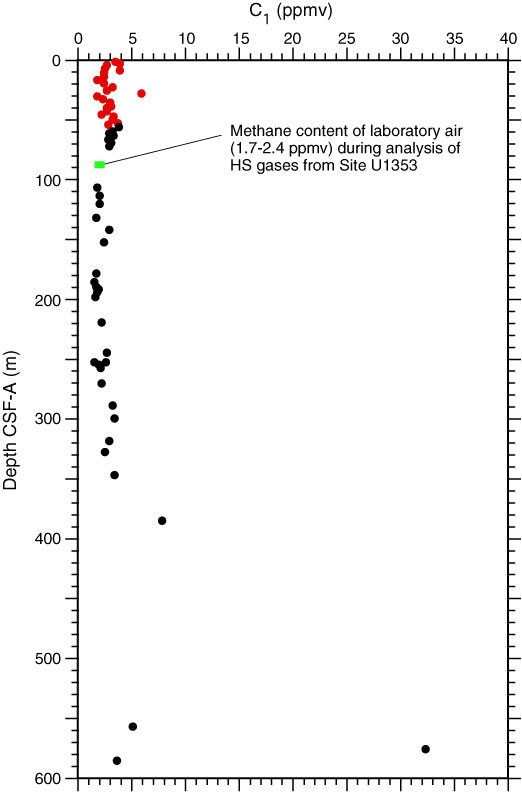
Figure F32. Plots of methane (C1) concentrations (parts per million by volume [ppmv]) in headspace (HS) gas vs. depth, Holes U1353A (red) and U1353B (black).
Previous | Close | Next | Top of page