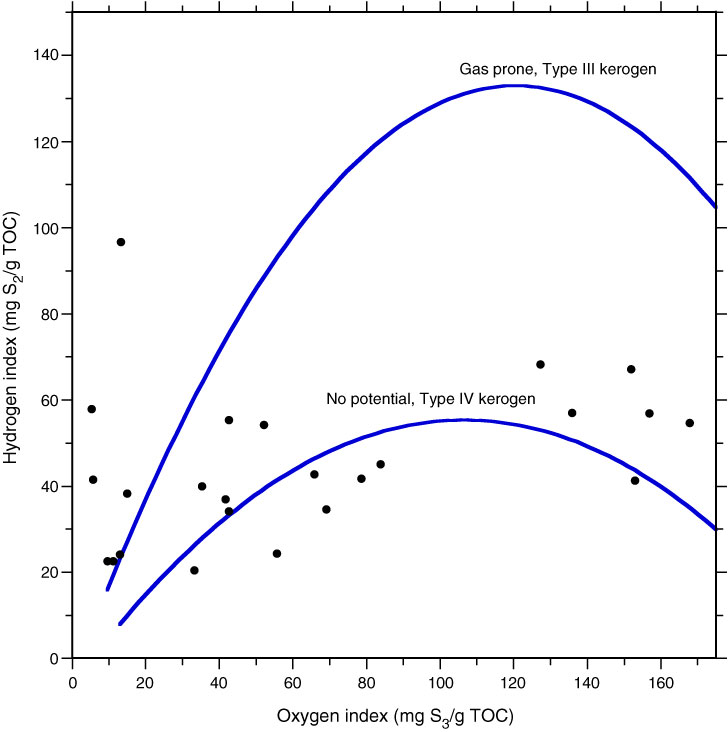
Figure F37. Modified and enlarged van Krevelen diagram based on a cross-plot of hydrogen index vs. oxygen index, showing trend lines for kerogen Types III and IV, Site U1353. Trend lines for kerogen Types I and II are not shown. Oxygen values for Sections 317-U1353B-9H-1 (57.55 m) and 41H-1 (202.20 m) are >170 and are not shown on this diagram. TOC = total organic carbon from SRA.
Previous | Close | Next | Top of page