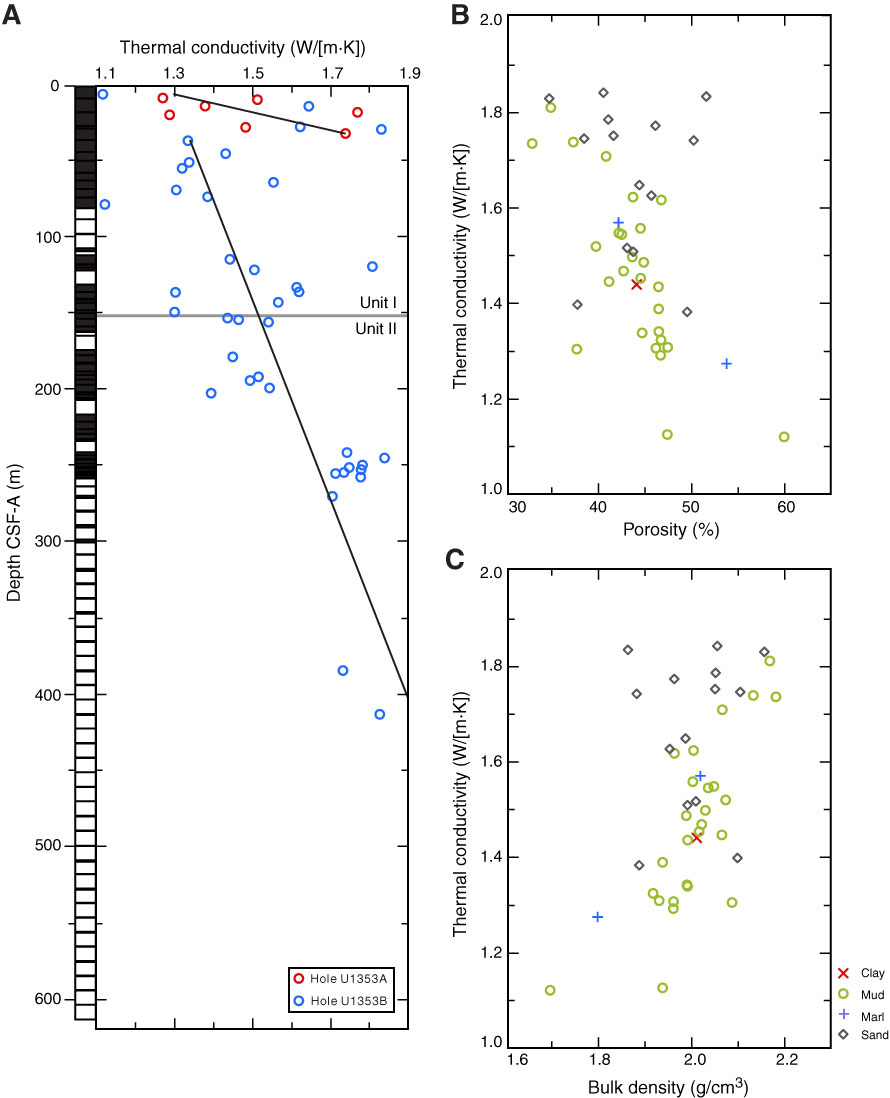
Figure F46. Thermal conductivity for Site U1353 vs. (A) depth, (B) porosity, and (C) bulk density. Thermal conductivity measurements from Holes U1353A and U1353B were used to determine the relationship between thermal conductivity and depth. The two linear fits (black lines) represent downhole increasing trends with a peak at ~30 m CSF-A, which was also observed at shelf Site U1351. Thermal conductivity correlates negatively with porosity and positively with bulk density. Variation with lithology is weak.
Previous | Close | Next | Top of page