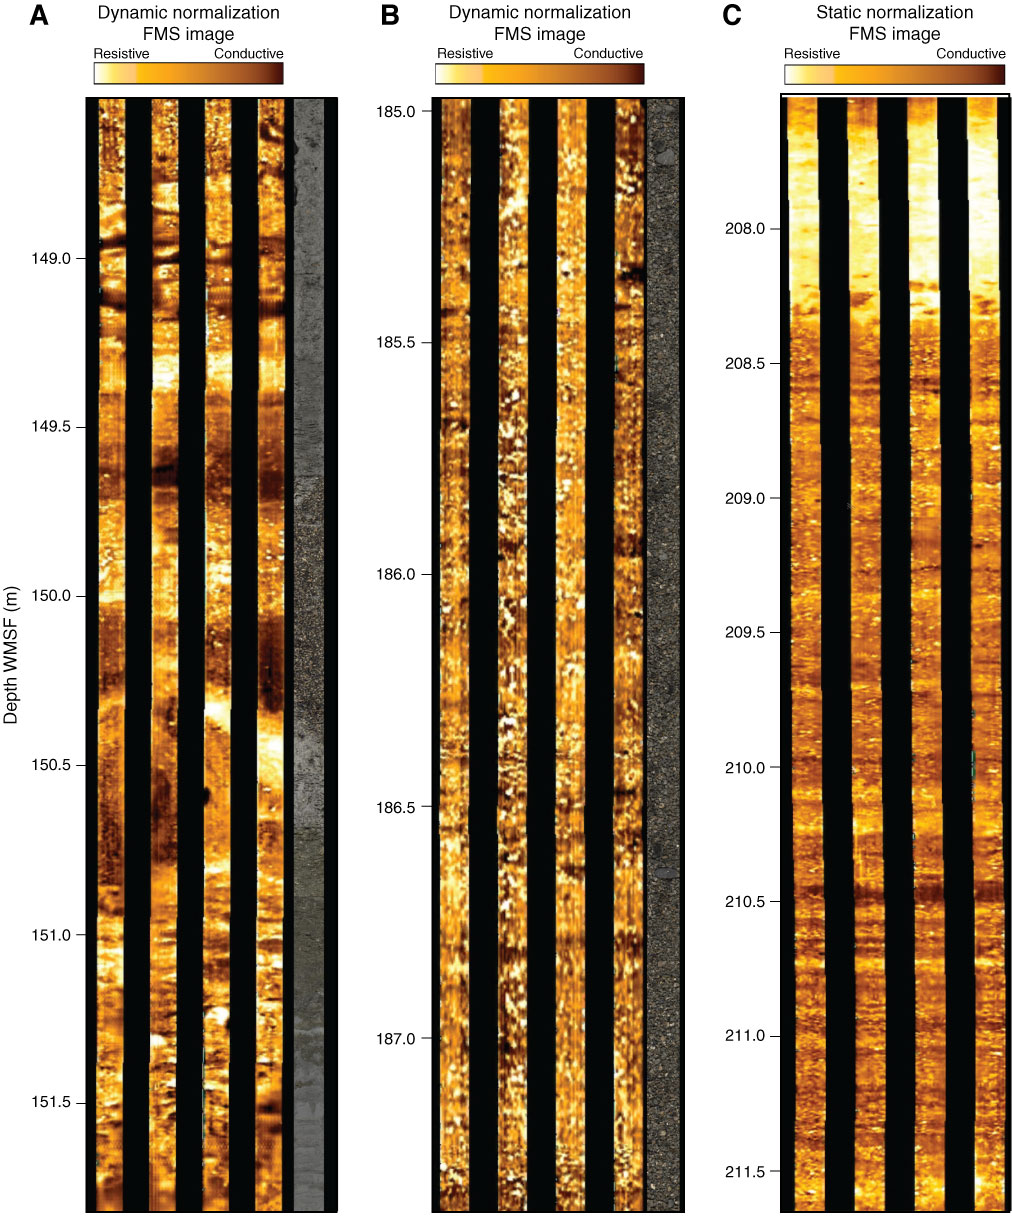
Figure F50. Formation MicroScanner (FMS) images showing the diversity of structures in Hole U1353C. Associated core photographs from Hole U1353B are also shown. A. Bottom of lithologic Unit I (Sections 317-U1353B-27H-3, 28H-1, and 28H-2). B. Gravels (Sections 317-U1353B-36H-2, 36H-3, and 36H-4). C. Fine layering where no core was recovered in Hole U1353B. High resistivity is apparent as brighter colors and high conductivity is apparent as darker colors in the FMS images. FMS images in A and B are dynamically normalized to enhance small-scale contrasts, and the colors are not representative of absolute formation resistivity.
Previous | Close | Next | Top of page