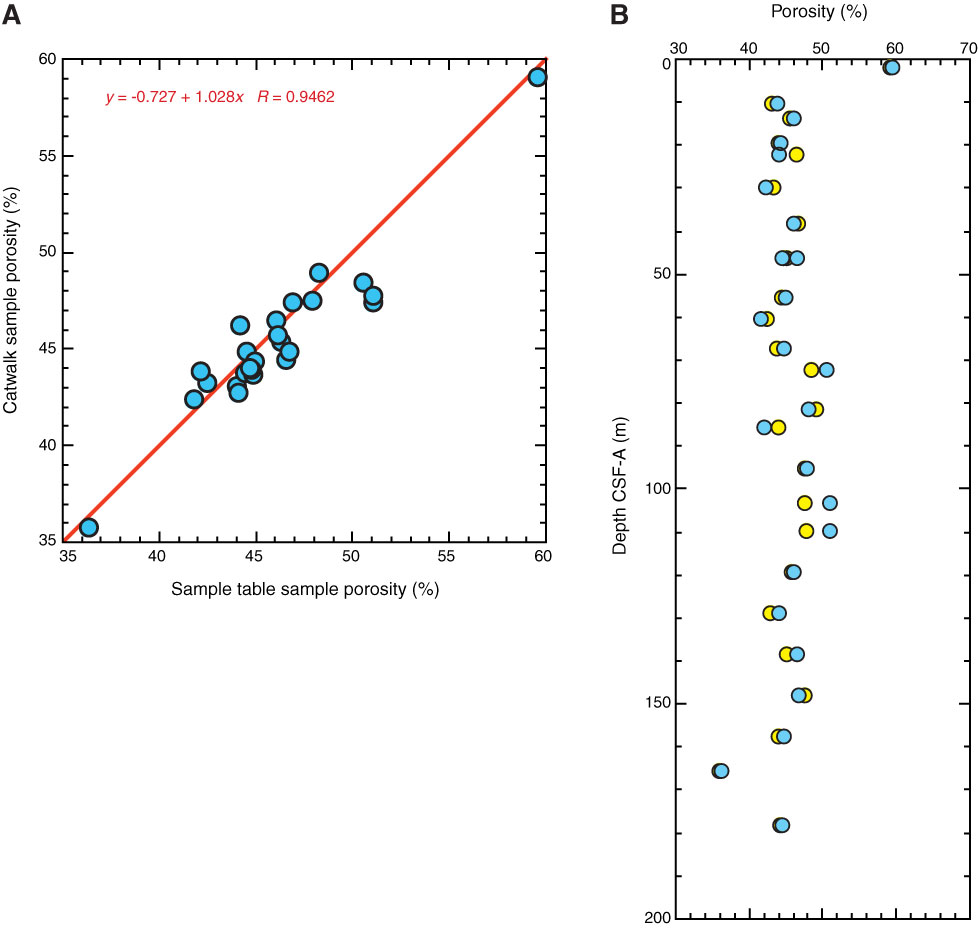
Figure F24. Porosity from MAD catwalk samples compared with adjacent samples from the sample table, Hole U1354B. A. Cross-plot of porosities resulting from the two sampling methods. Samples below the red line had more water on the sample table and those above the line had more water when collected immediately on the catwalk. The linear correlation between the two is shown. B. Porosities plotted as a function of depth. Yellow = catwalk samples, blue = sample table samples.
Previous | Close | Next | Top of page