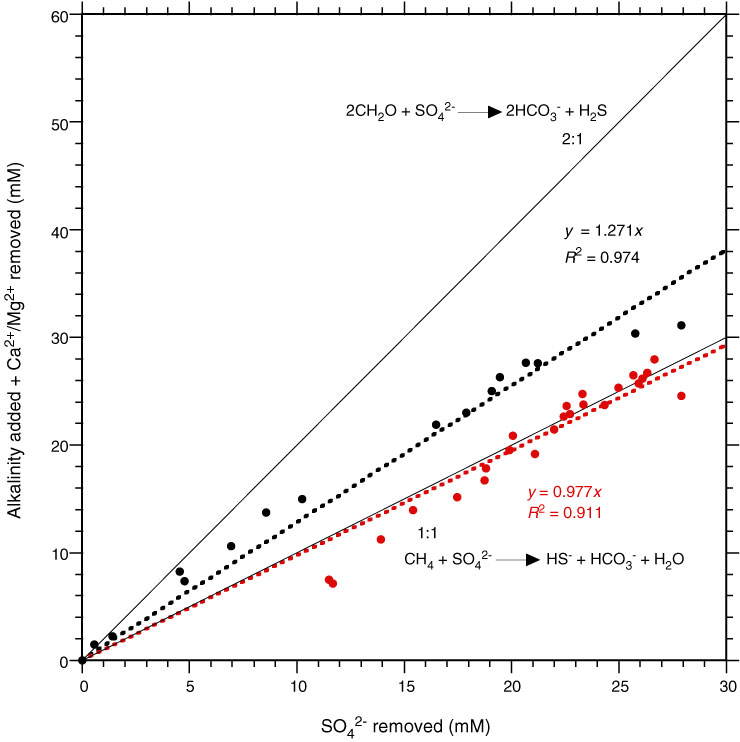
Figure F35. Plot of alkalinity added plus calcium and magnesium removed vs. sulfate removed, showing stoichiometry of the sulfate-reduction zone for samples shallower than 41 m (black) and samples between 61 and 178 m (red). Equations for methane oxidation (bottom) and organic matter oxidation (top) are shown. Data from the shallow zone plot close to the 1.3:1 line (correlation line and equation shown in black), and data from the deeper zone plot close to the 1:1 line (correlation line and equation shown in red).
Previous | Close | Next | Top of page