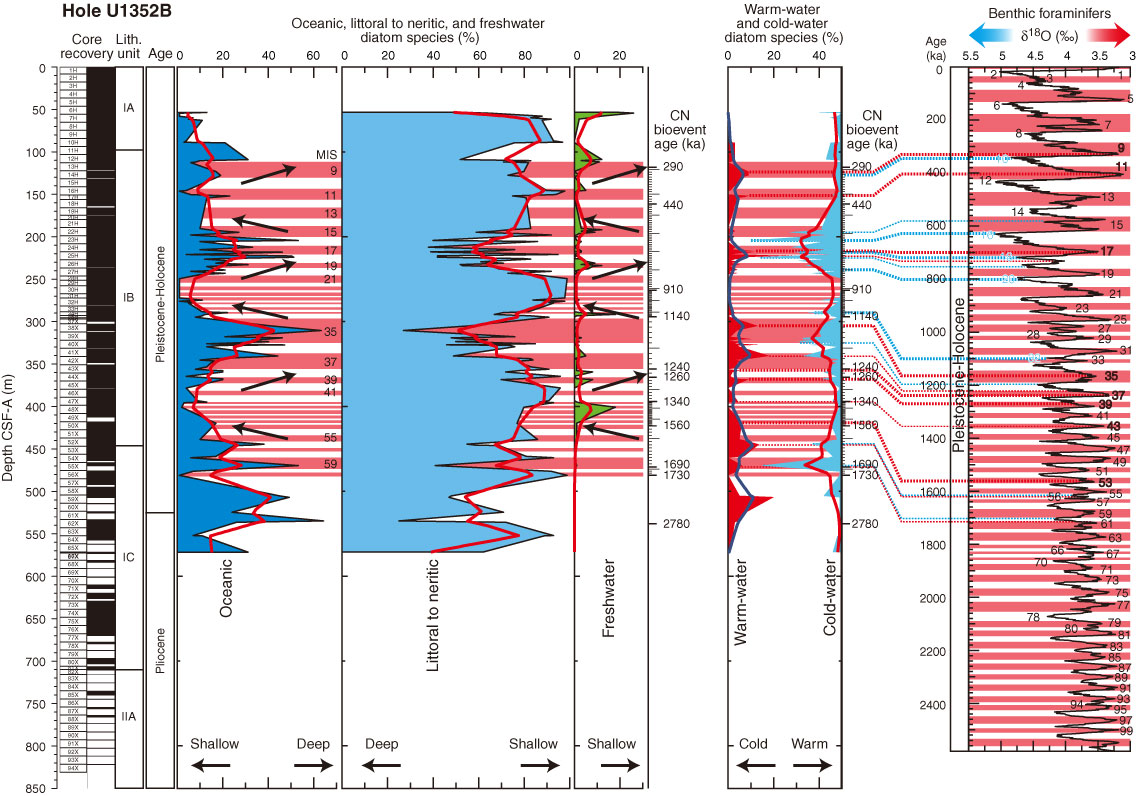
Figure F3. Marine, littoral to neritic, and freshwater diatom abundances and percentages of warm-water vs. cold-water diatoms. A total of 111 slides with better preserved and abundant diatoms (≥50 valves/slide) were selected and used for paleoceanographical analysis. Benthic δ18O records and marine isotope stages (MIS) are after Lisiecki and Raymo (2005). Pink highlights indicate warm periods. Regression curves (red and blue lines on each figure) were drawn by spline smoothing.
Previous | Close | Top of page