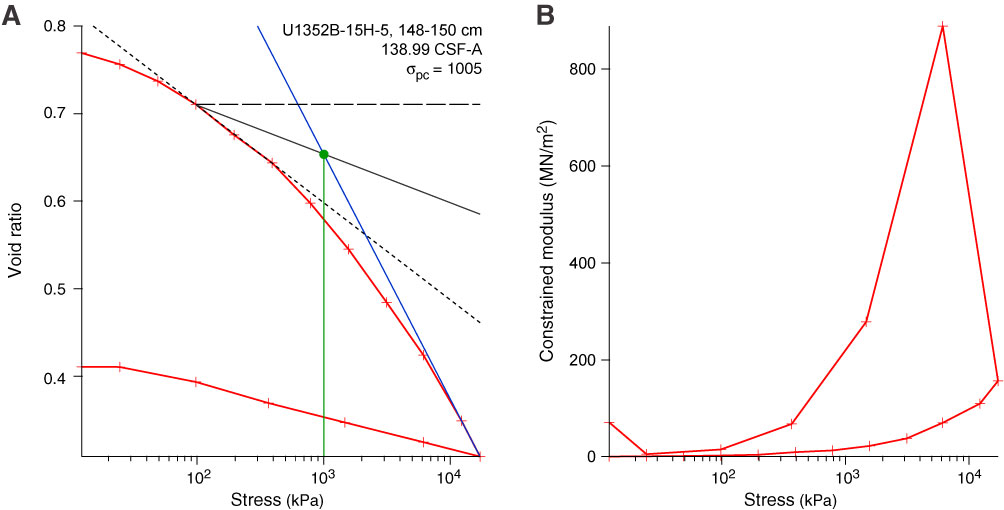
Figure F15. Results of uniaxial consolidation test (interval 317-U1352B-15H-5, 148–150 cm) represented by a semilogarithmic plot of (A) void ratio vs. vertical effective stress and (B) constrained modulus vs. vertical effective stress. Green dot = maximum past effective stress (σpc) derived by the graphical method of Casagrande (1936). σpc corresponds to the abscissa of the point of intersection between the backward projected virgin compression line (blue) and the bisecting line (black solid) between the horizontal line (black dashed) and the tangent (black dotted) at the point of maximum curvature of the consolidation curve (red).
Previous | Close | Next | Top of page