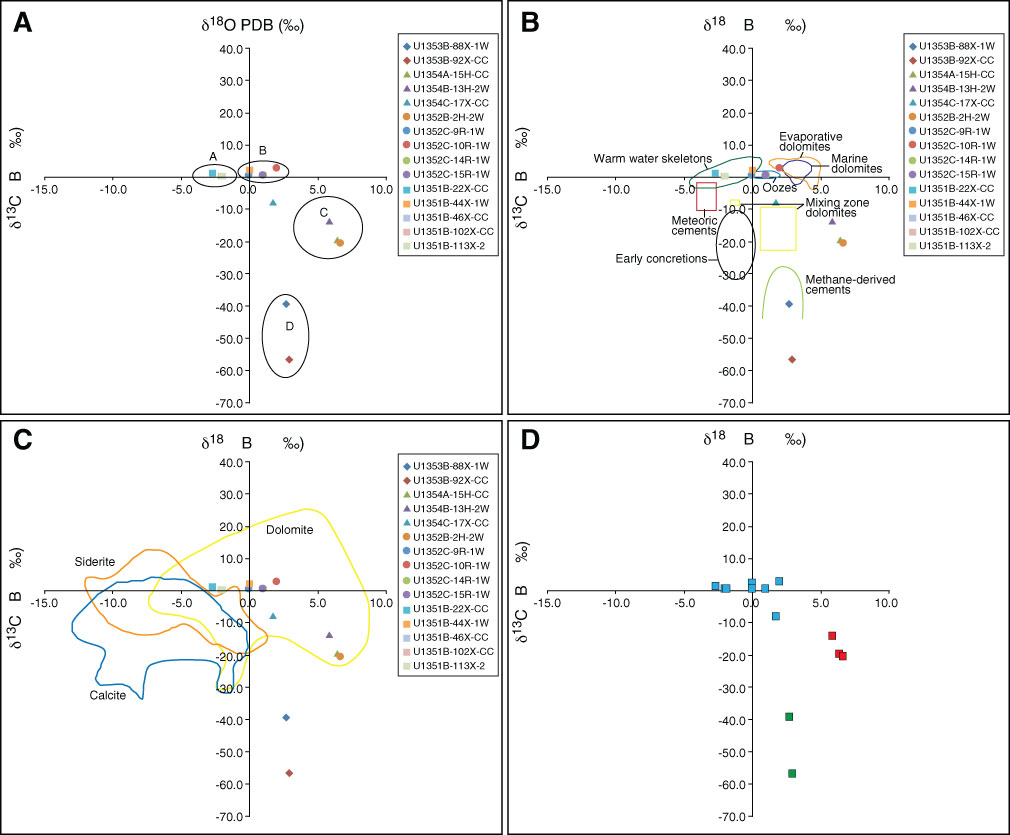
Figure F4. Isotopic data. A. Arbitrary grouping based on clustering. B. Plot with literature values as modified from Nelson et al. (1996). C. Plot with literature values from Mozley and Burns (1993). D. Plot based on phase identification from XRD. Blue = calcite, red = dolomite, green = Mg calcite.
Previous | Close | Top of page