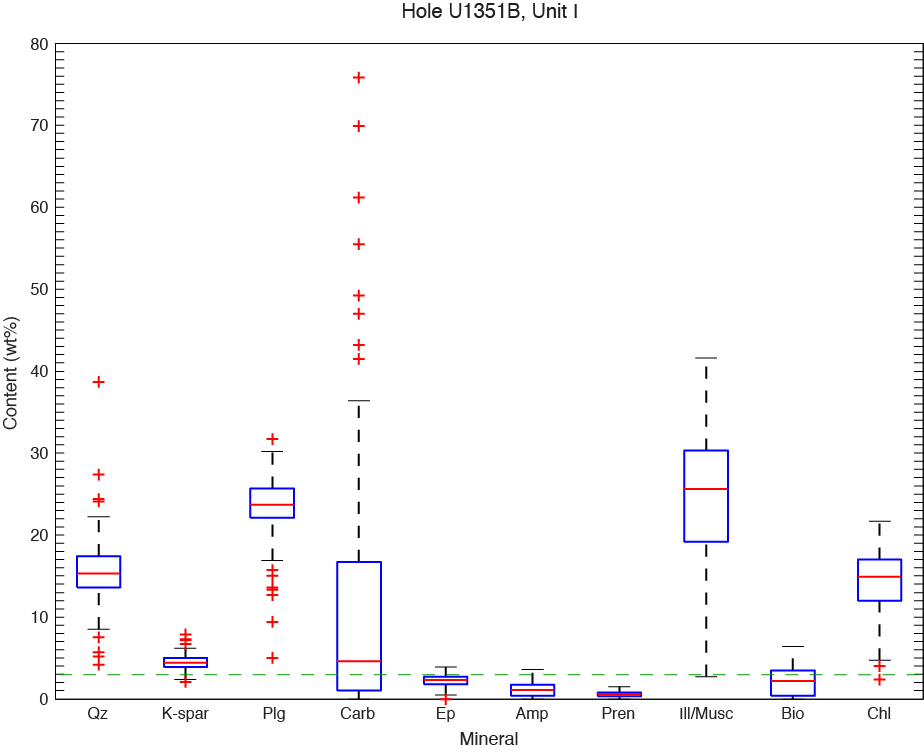
Figure F5. Box plot of the possible primary minerals in Unit I, Hole U1351B. Boxes represents 25% to 75% of the population; the horizontal line in the box represents the median value. Lines extending outward from the boxes include the expected normal ranges. Outliers are shown by red crosses (Davis, 2002). Green dashed line is the analytical threshold considered for a valid concentration (3 wt%). See Table T4 for mineral abbreviations.

Previous | Close | Next | Top of page