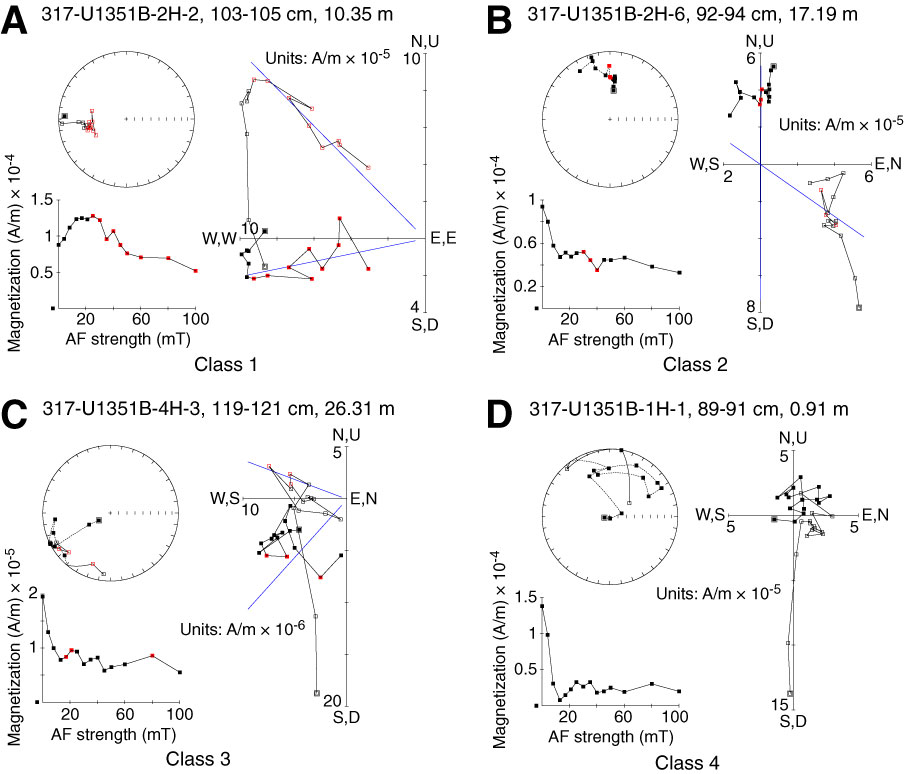
Figure F1. Alternating field (AF) demagnetization behavior illustrating the defined quality/behavior classes for samples from Hole U1351B. A. Class 1. B. Class 2. C. Class 3. D. Class 4. For orthogonal vector plots: open symbols represent data projected on the vertical plane, solid symbols represent data projected on the horizontal plane, red symbols indicate data that are selected for principal component analysis (PCA), and blue line indicates the PCA fit. In equal-area stereo plots: open symbols represent data on the upper hemisphere (negative inclinations), solid symbols represent data on the lower hemisphere (positive inclinations).
Close | Next | Top of page