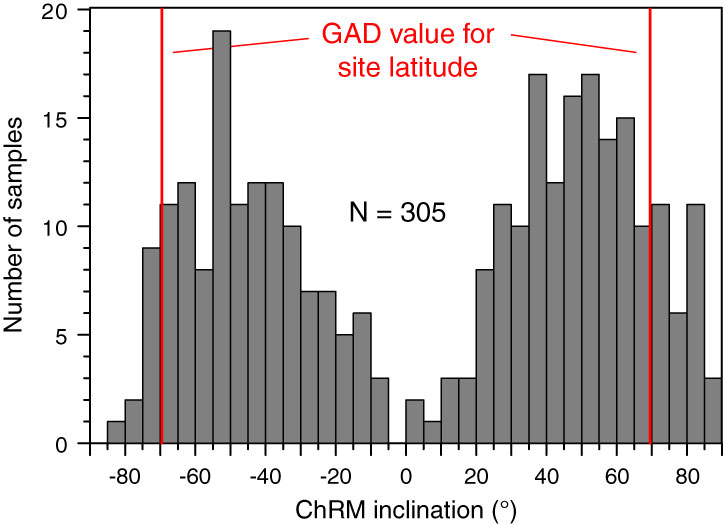
Figure F4. Histogram of Class 1 and 2 normal and reversed polarity ChRM inclinations for discrete samples, Expedition 317. Vertical lines indicate inclinations for a geocentric axial dipole (GAD) field at the site latitude.
Previous | Close | Next | Top of page