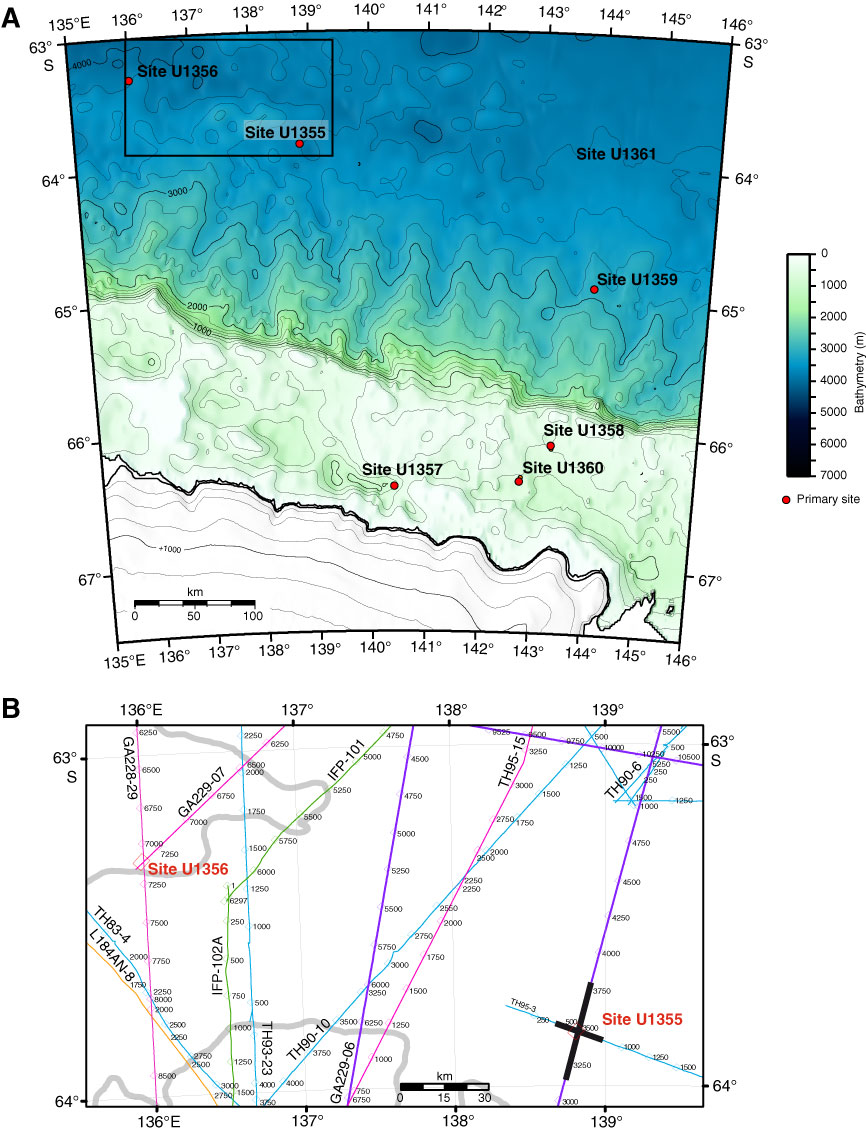
Figure F13. A. Bathymetric map of eastern Wilkes Land margin showing the location of Site U1355 and other Expedition 318 drill sites. Contour interval = 250 m. Box = approximate area of B. B. Navigation map of seismic reflection profiles across and in the vicinity of Site U1355. Bold lines = multichannel seismic reflection profiles shown in Figure F14.
Previous | Close | Next | Top of page