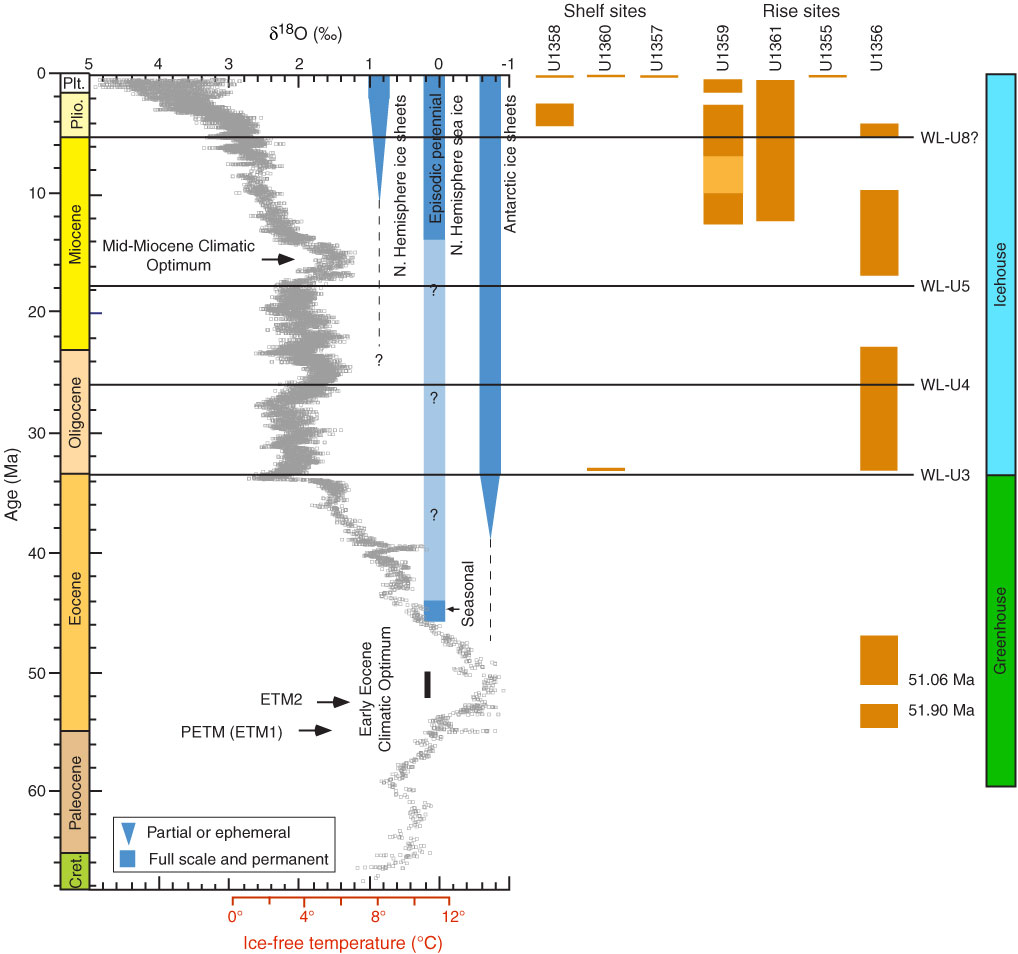
Figure F24. Stacked deep-sea benthic foraminifer oxygen isotope curve for 0–65 Ma (updated from Zachos et al., 2008) converted into Gradstein timescale (Gradstein et al., 2004), and combined with chronostratigraphy of the sites drilled during Expedition 318. ETM2 = Eocene Thermal Maximum 2, PETM = Paleocene/Eocene Thermal Maximum, ETM1 = Eocene Thermal Maximum 1.
Previous | Close | Next | Top of page