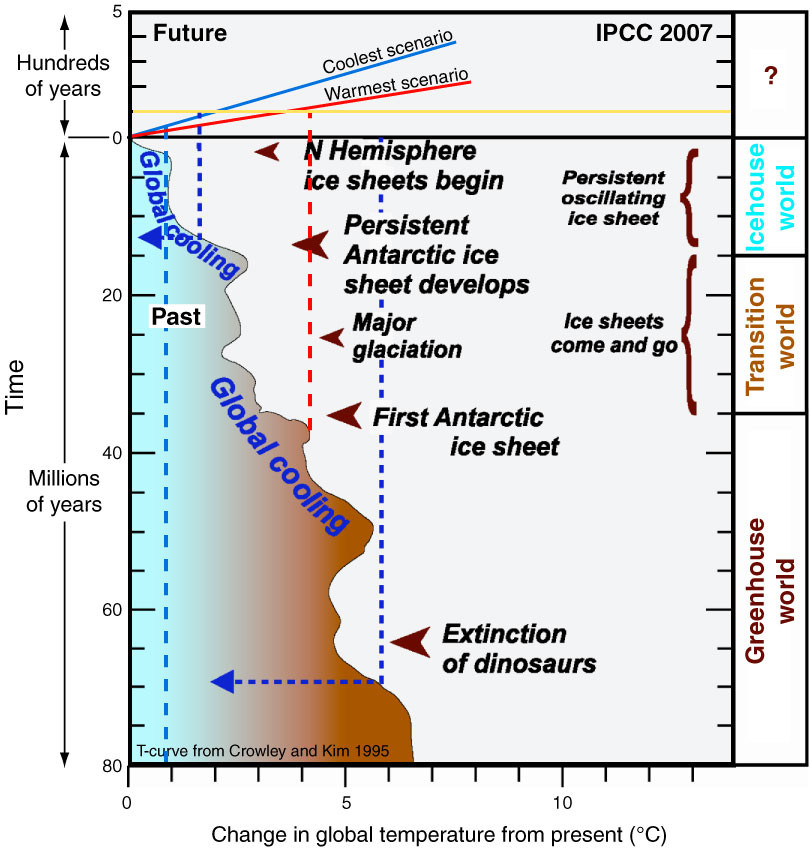
Figure F3. Earth’s temperature variability during the last 80 m.y. based on reconstructions from deep-marine oxygen isotope records. Future atmospheric temperature scenarios, based on Intergovernmental Panel on Climate Change (2007, www.ipcc.ch/) greenhouse trace gas forecasts, are shown at top of diagram.
Previous | Close | Next | Top of page