Previous | Close | Next
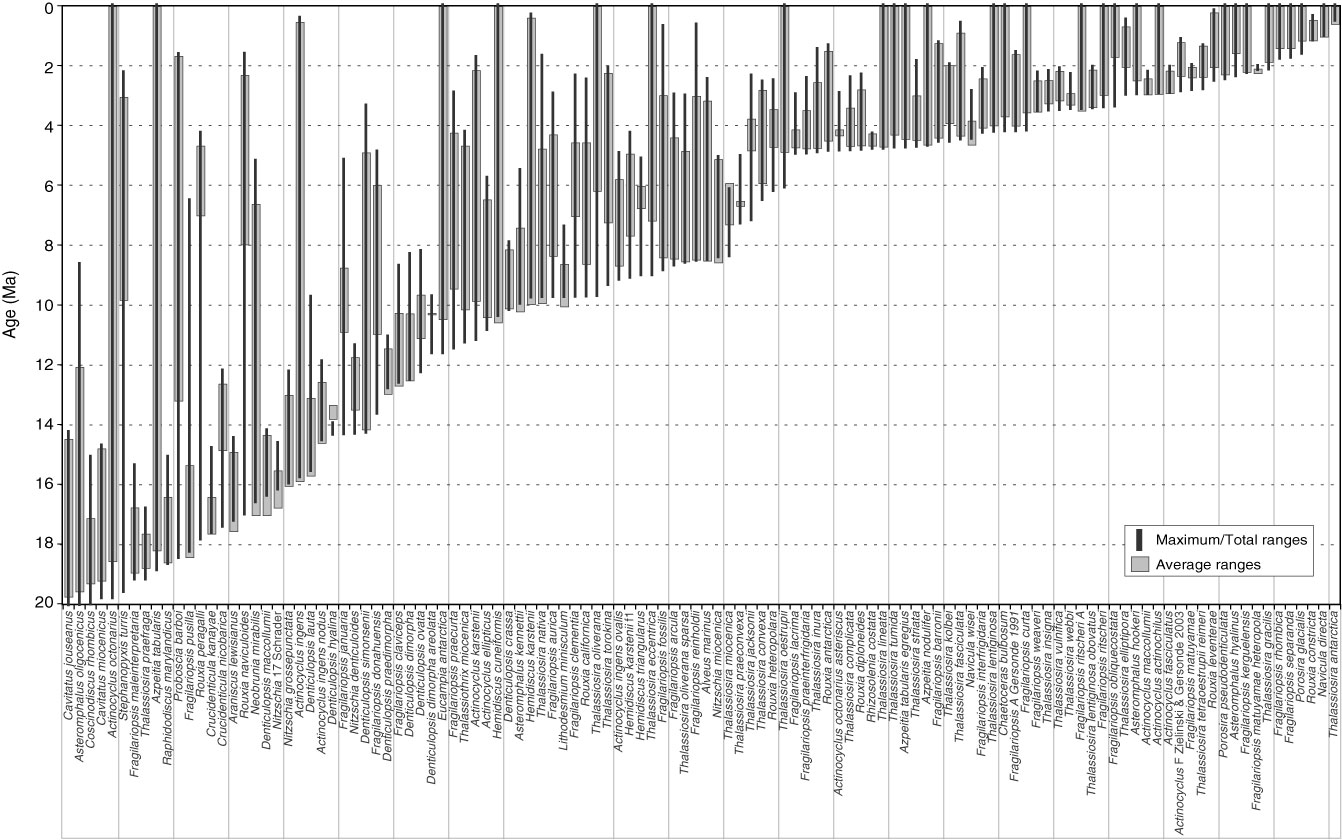
Figure F6. Composite range chart of diatom taxa used during Expedition 318 (from Cody et al., 2008). Black lines = total range model, gray shaded lines = average range model.
Previous | Close | Next | Top of page