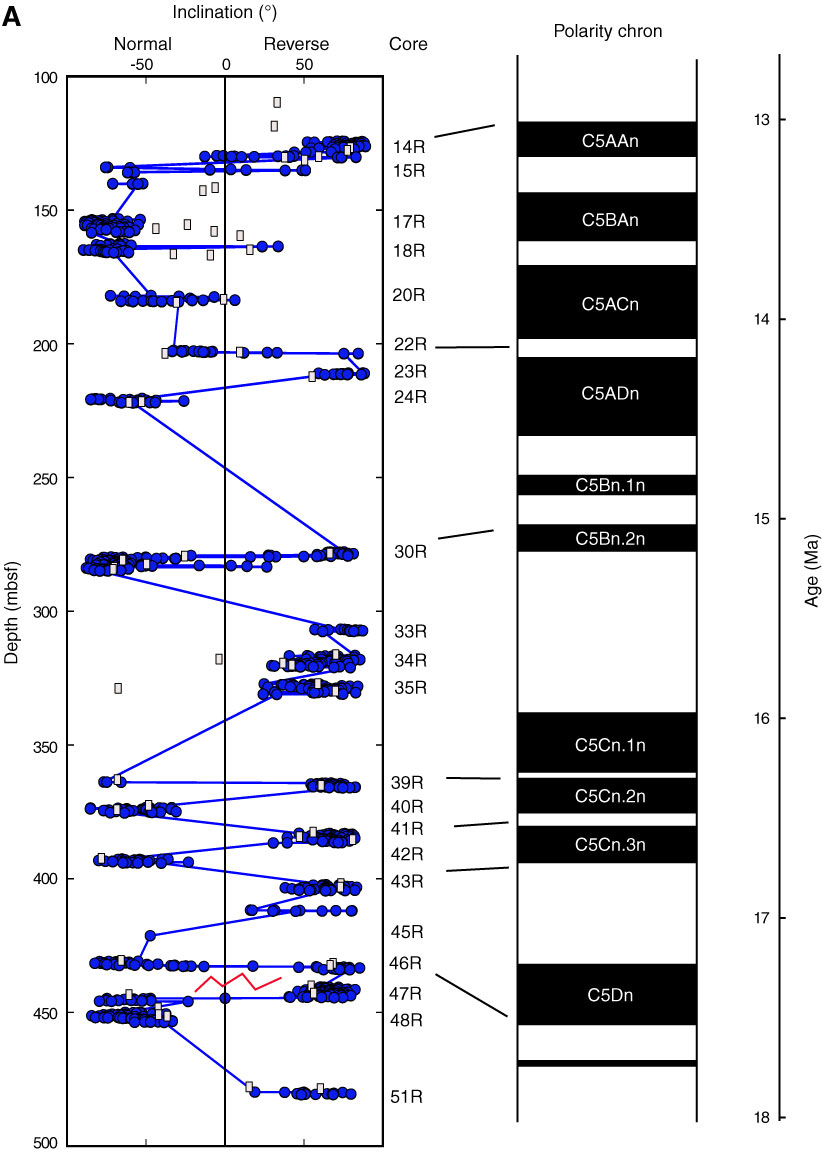
Figure F21. Correlation of magnetostratigraphy in Hole U1356A to the geomagnetic polarity timescale of Gradstein et al. (2004) (see Table T5 in the “Methods” chapter). Left panels are the inclinations from Figure F16 after demagnetization to 20 mT and edited as described in the text. Tie points identified in Table T1 are shown. A. Cores 318-U1356A-14R through 51R. Solid circles = data from archives, open squares = data from discrete samples. (Continued on next two pages.)
Previous | Close | Next | Top of page