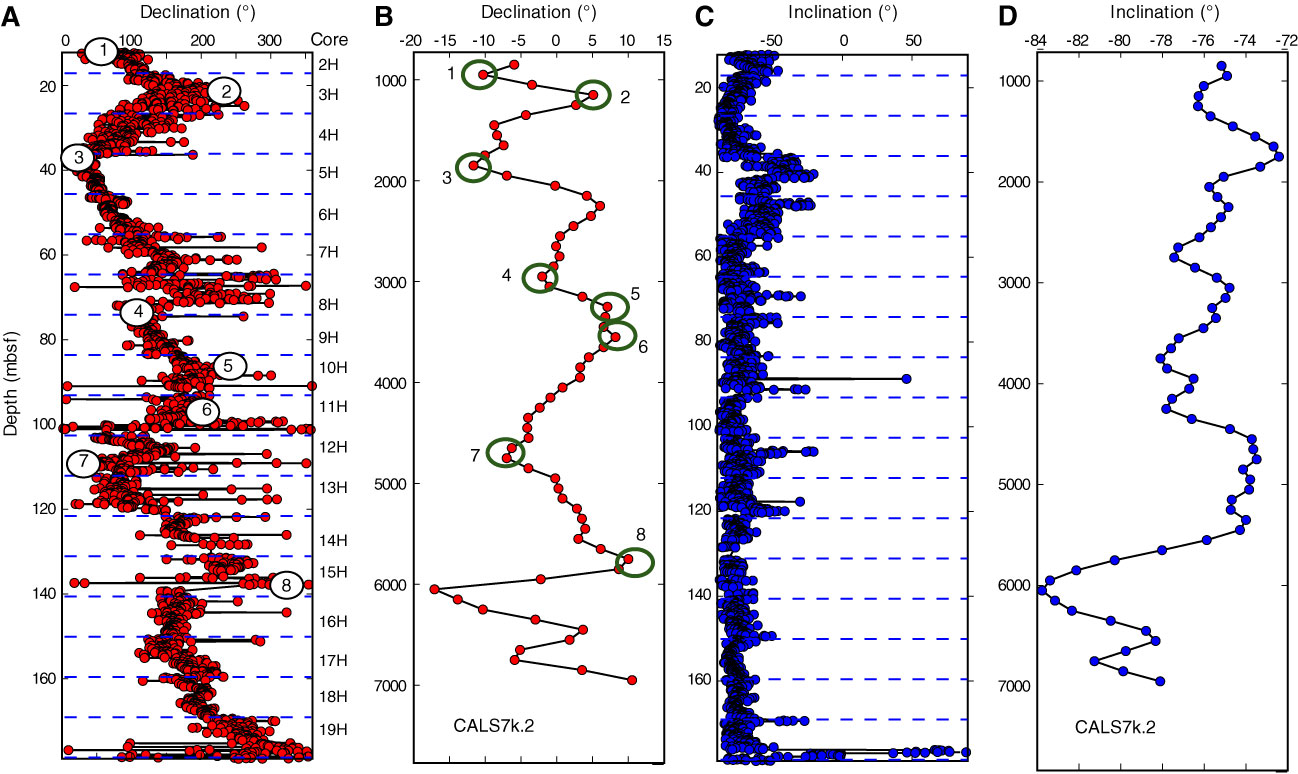
Figure F25. A. Plot of declinations from Figure F22B after rotation of each core top to coincide with the last declination from the previous core. The first core top was rotated to 45°. Tie points to CALS7k.2 model shown in B are numbered as in Table T5 and Figure F26. B. Declinations predicted for the location of Site U1357 from the CALS7k.2 secular variation model (Korte and Constable, 2005). Note difference in scale between A and B. C. Observed inclinations after demagnetization at 20 mT (Fig. F22B). D. Predicted inclinations from the CALS7k.2 model.
Previous | Close | Next | Top of page