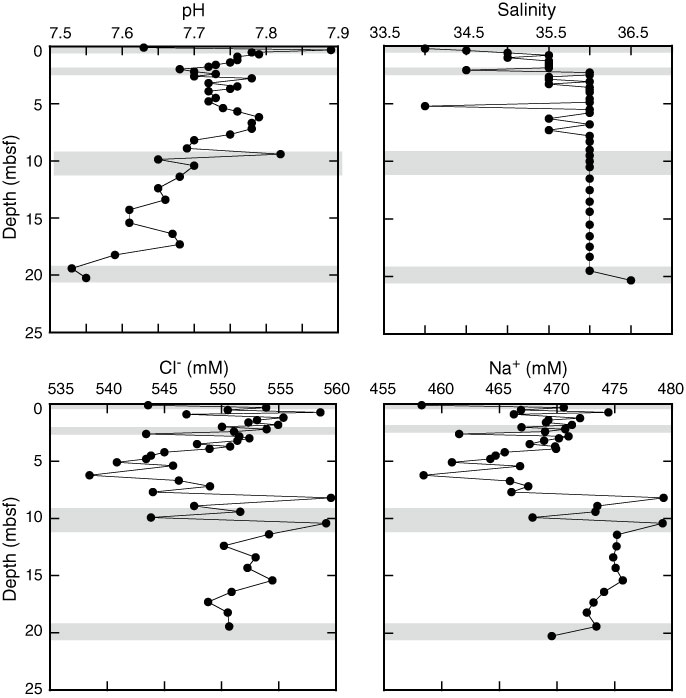
Figure F34. Interstitial water profiles for pH, salinity, chloride, and sodium, Hole U1357C. Shaded intervals = levels in the core where likely seawater infiltration occurred, based on elevated SO42– concentrations.
Previous | Close | Next | Top of page