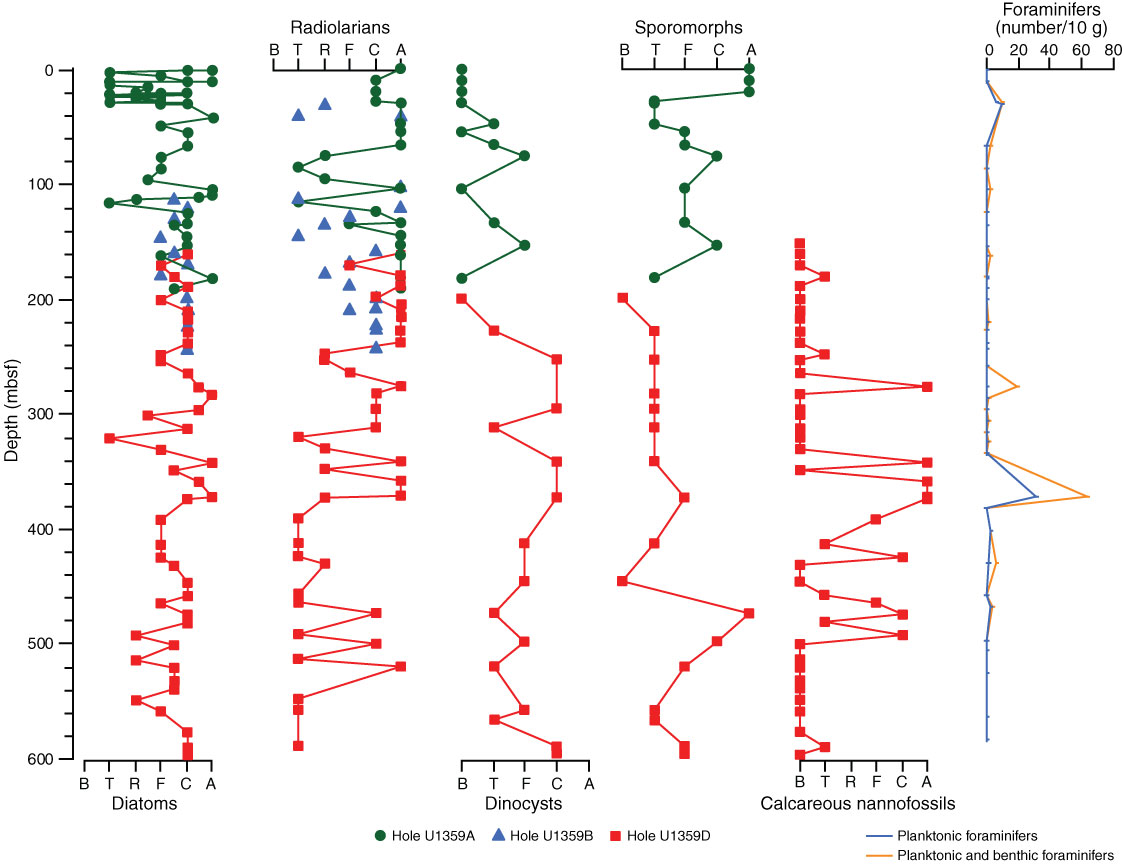
Figure F26. Plots of microfossil abundance vs. depth, Site U1359. Green = Hole U1359A, blue = Hole U1359B, red = Hole U1359D. B = barren, T = trace, R = rare, F = few, C = common, A = abundant. Foraminifer abundance: orange = planktonic plus benthic, blue = planktonic only.
Previous | Close | Next | Top of page