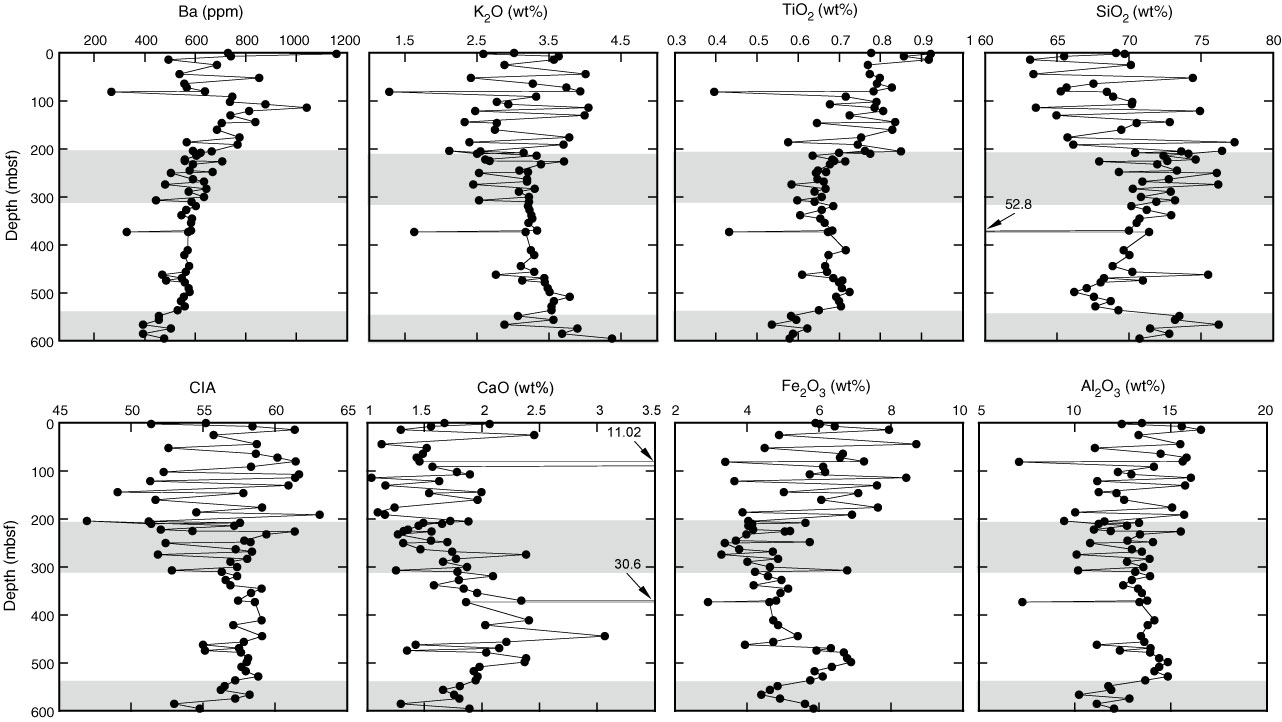
Figure F37. Plots of bulk geochemical data and calculated molar ratios for the chemical index of alteration (CIA), Site U1359. For details on CIA calculation see text. Shaded areas = intervals distinguished based on geochemical data.
Previous | Close | Next | Top of page