Previous | Close | Next
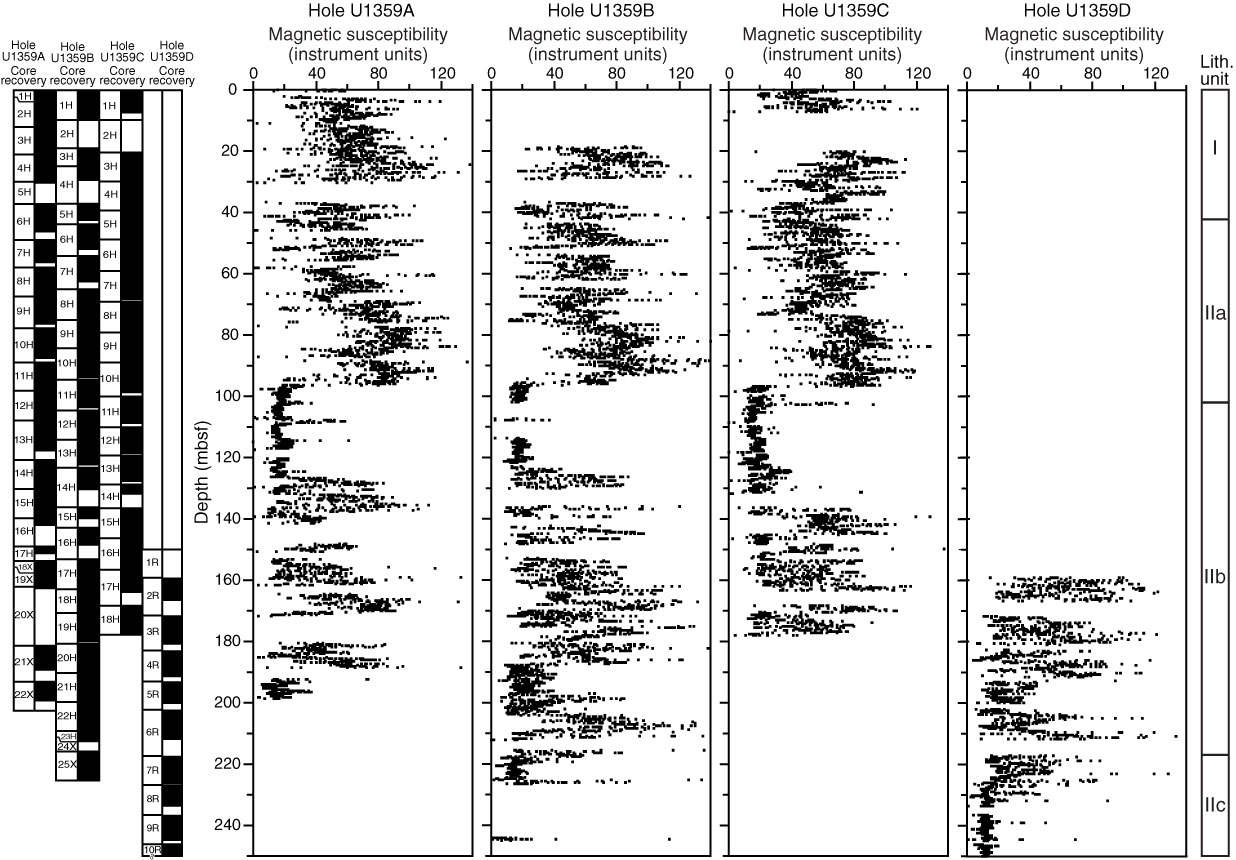
Figure F42. Plots of magnetic susceptibility data from 0 to 250 mbsf, Site U1359.
Previous | Close | Next | Top of page