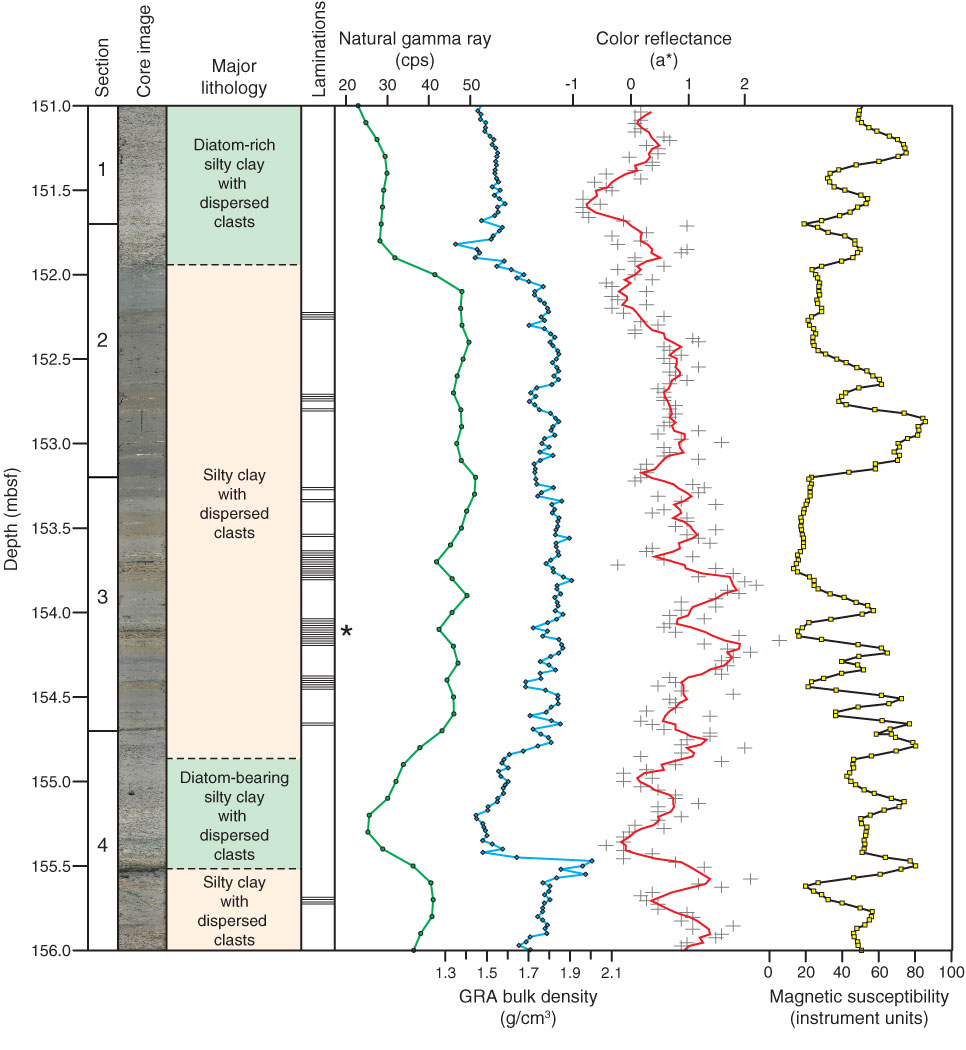
Figure F6. Core image of alternating beds of silty clay with dispersed clasts and diatom-rich silty clay with dispersed clasts in lithostratigraphic Subunit IIb plotted with physical property data (interval 318-U1359B-17H-1, 80 cm, through 17H-4, 130 cm). * = position of the silt laminations highlighted in Figure F16. GRA = gamma ray attenuation. Red line = five-point running mean, gray plus symbols = raw data.
Previous | Close | Next | Top of page