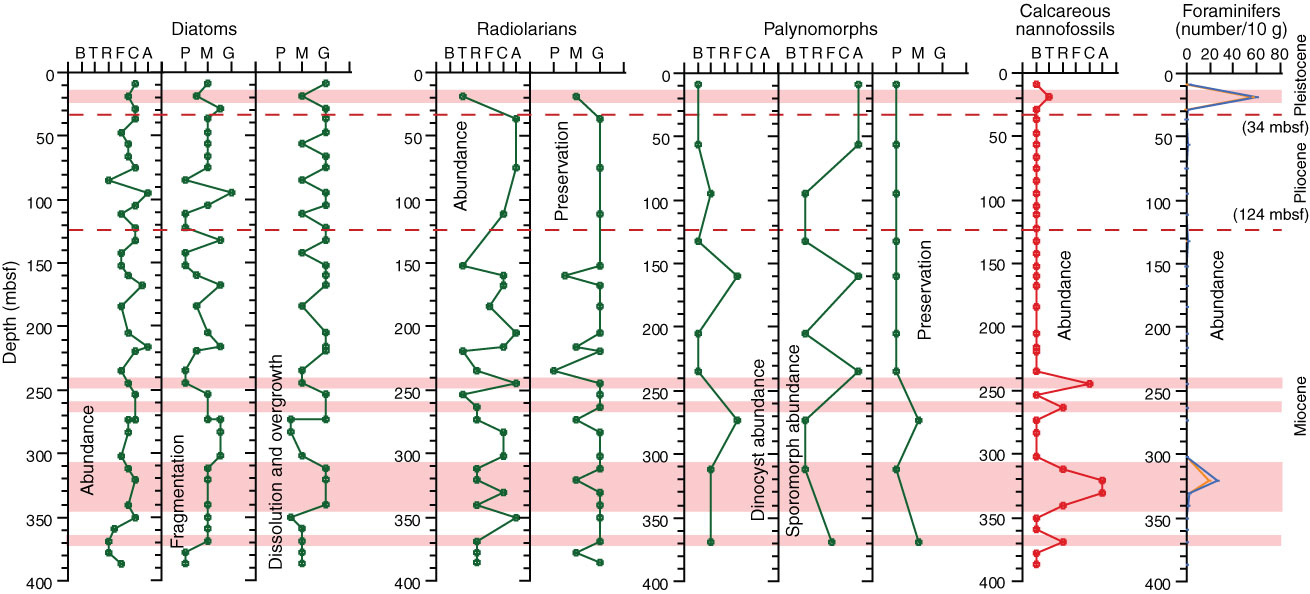
Figure F10. Plots of microfossil abundance vs. depth, Hole U1361A. Abundance: A = abundant, C = common, F = few, R = rare, T = trace, B = barren. Preservation: G = good, M = moderate, P = poor. Foraminifer abundance: orange = calculated benthic, blue = benthic total. Pink shading = calcareous nannofossil–rich intervals.
Previous | Close | Next | Top of page