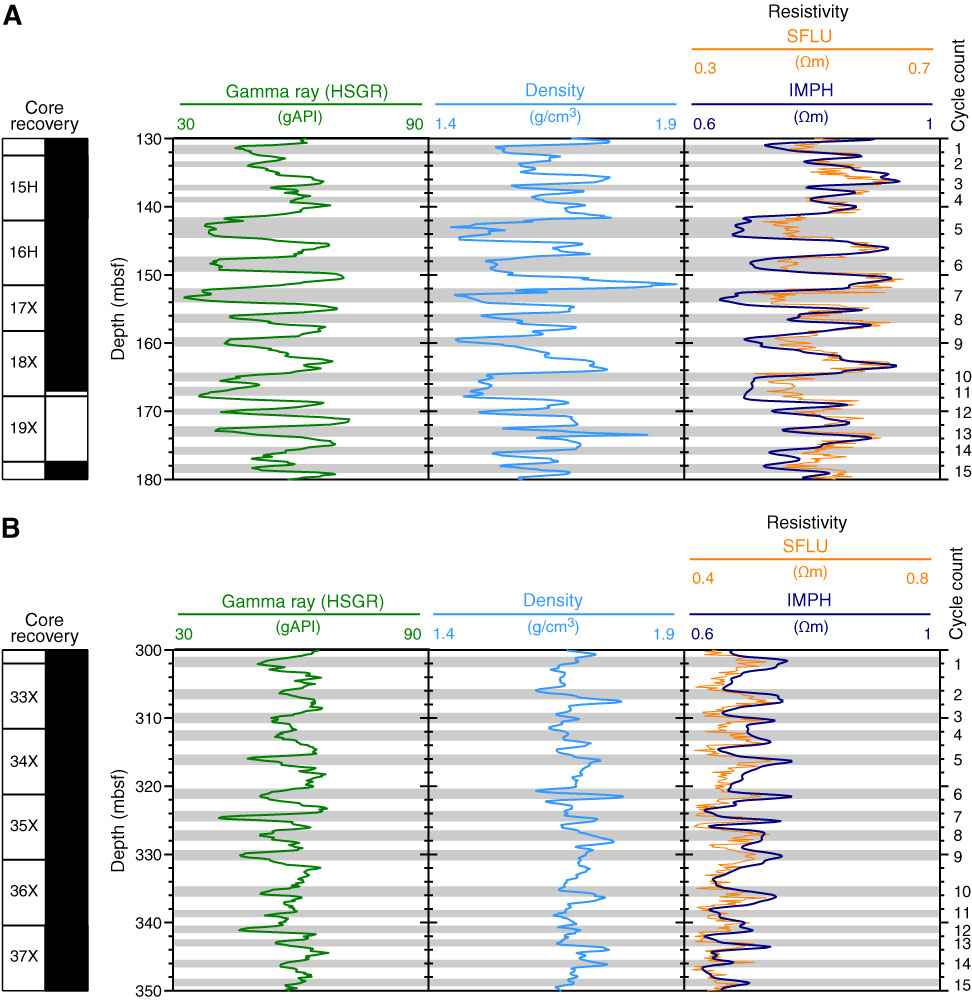
Figure F31. Comparison of downhole logs near the (A) top (130–180 mbsf) and (B) bottom (300–350 mbsf) of the logged interval of Hole U1361A, with correlation between gamma radiation and resistivity logs in A and anticorrelation in B. Grey bars = low NGR values thought to be caused by microfossil-rich sediment layers. The consecutive cycle count of these layers is given for the purpose of estimating the average duration of the alternations (see text). HSGR = total spectra gamma ray, SFLU = spherically focused resistivity, IMPH = medium induction phasor-processed resistivity.

Previous | Close | Next | Top of page