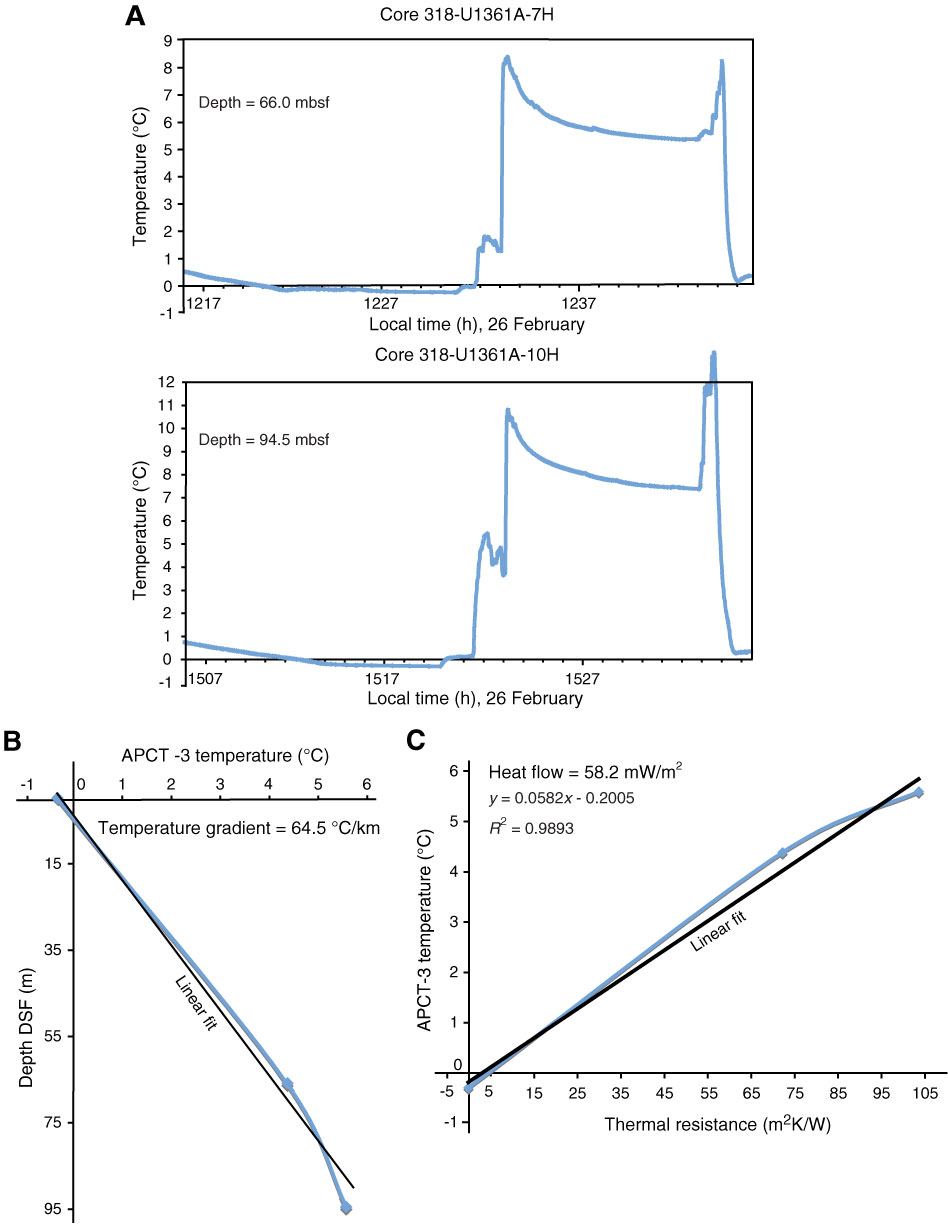
Figure F33. Diagrams of heat flow calculations, Hole U1361A. A. Advanced piston corer temperature tool (APCT-3) sediment temperatures. B. Temperature gradient. C. Bullard plot in which heat flow is calculated from a linear fit of the temperature data.

Previous | Close | Top of page