Previous | Close | Next
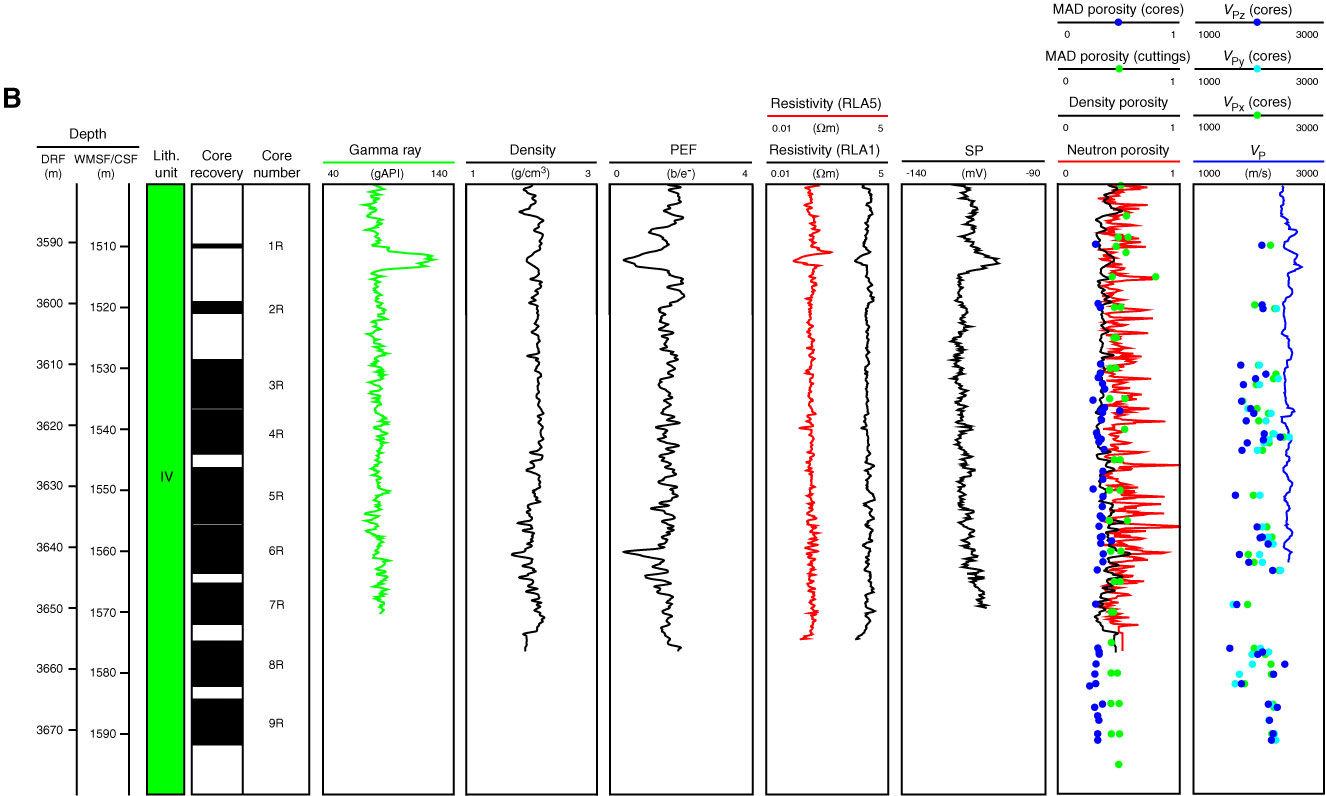
Figure F5 (continued). B. Site C0009 site summary diagram from 1510 to 1594 m CSF showing cuttings, core, and log data. PEF = photoelectric effect, SP = spontaneous potential, MAD = moisture and density.
Previous | Close | Next | Top of page