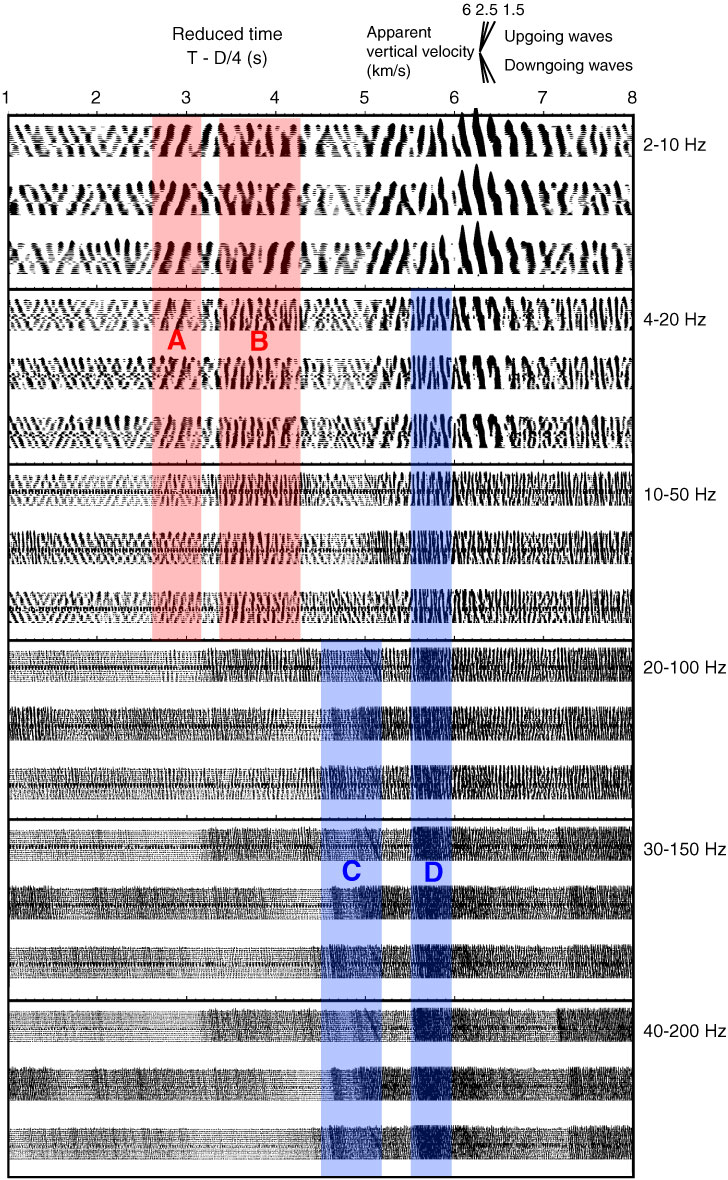
Figure F104. Frequency dependence of the vertical seismic record of all seismometers in the array shown for three walkaway VSP shots of offset ~10 km south of borehole. Receiver gathers of three consecutive shots are plotted for different frequency bands. Scale of vertical apparent velocity shown to illustrate upgoing and downgoing wave velocities. See text for description of shaded areas.
Previous | Close | Next | Top of page